


 menu
|
|
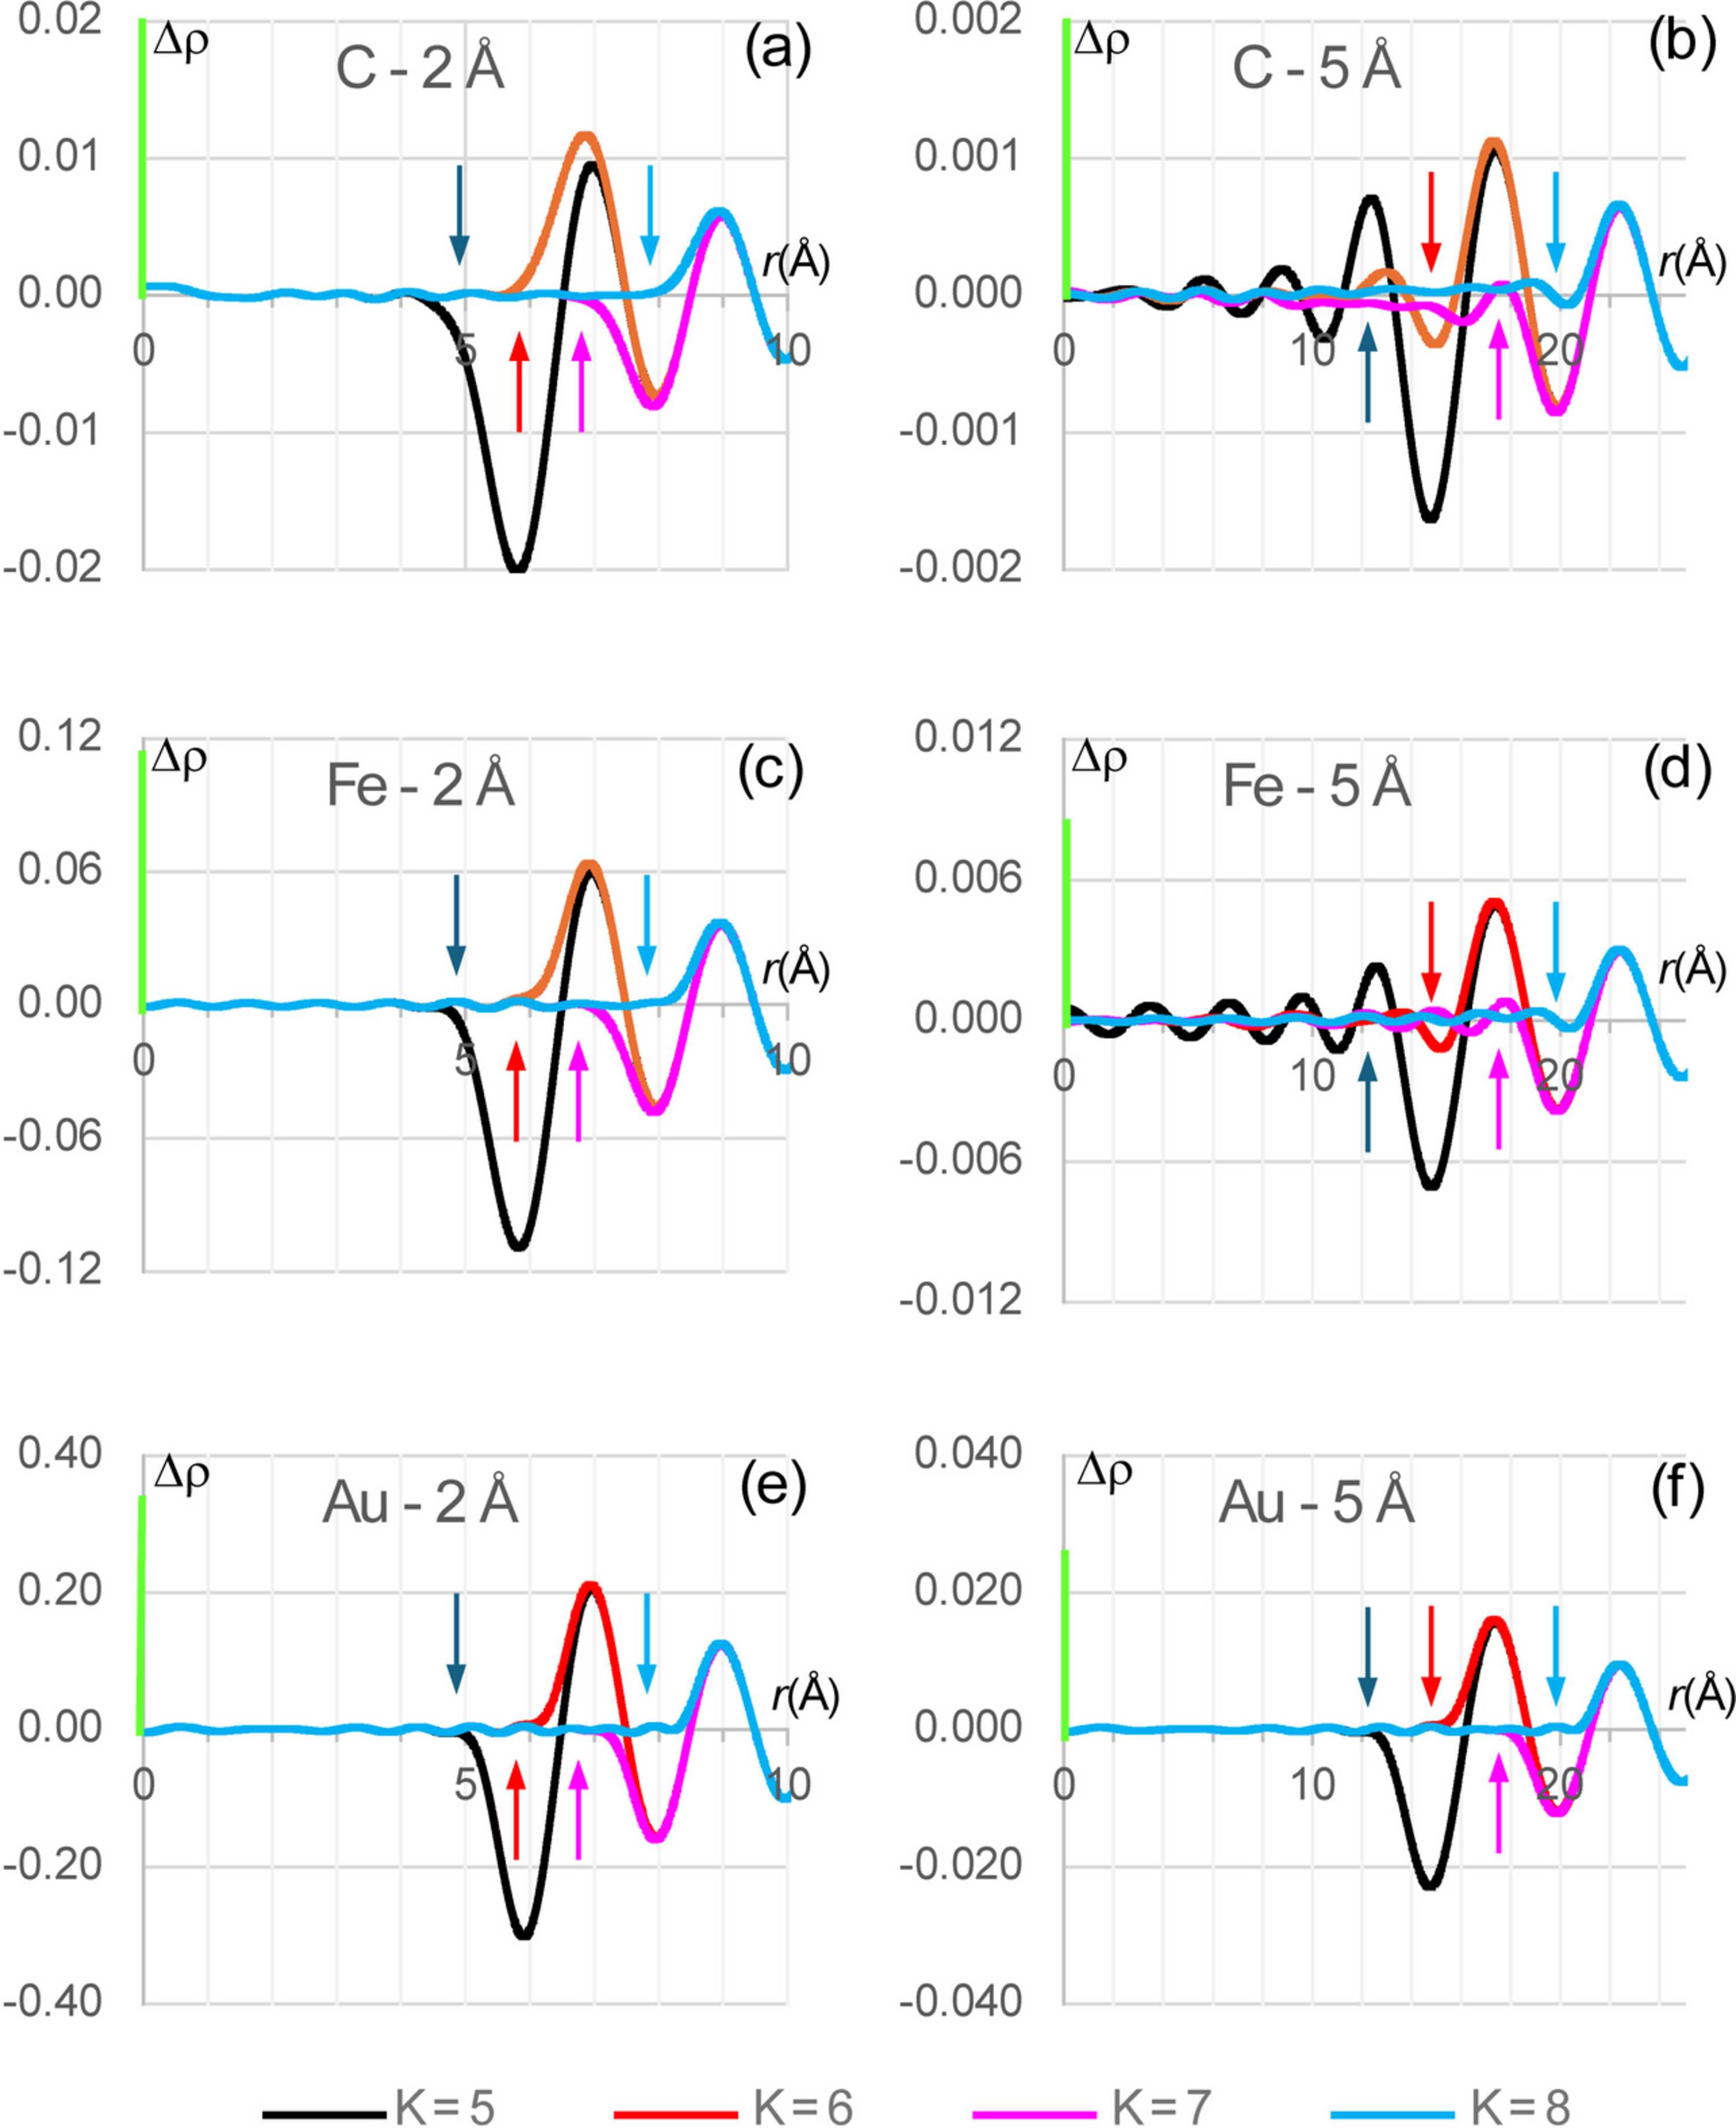
Figure 5
Difference, in e Å−3, as a function of the distance r to the atomic center, between the atomic image (8–9) for atoms of C, Fe and Au, and several approximations (1)  to it, varying the number of terms K. A green bar at the axis shows the value  of the respective atomic image at its center divided by 100.  is computed for images of resolution  of 2 Å and 5 Å up to the distance limit  . Colored arrows matching the curves' colors indicate the value of the largest  for the given approximation. Terms with  (considered here as  ,  ,  and  ) may be insufficient to produce an accurate approximation for the points close to  and one or two next terms beyond may notably reduce the error. |
IUCrJ
ISSN: 2052-2525
CRYO | EM
Open  access