


 menu
|
|
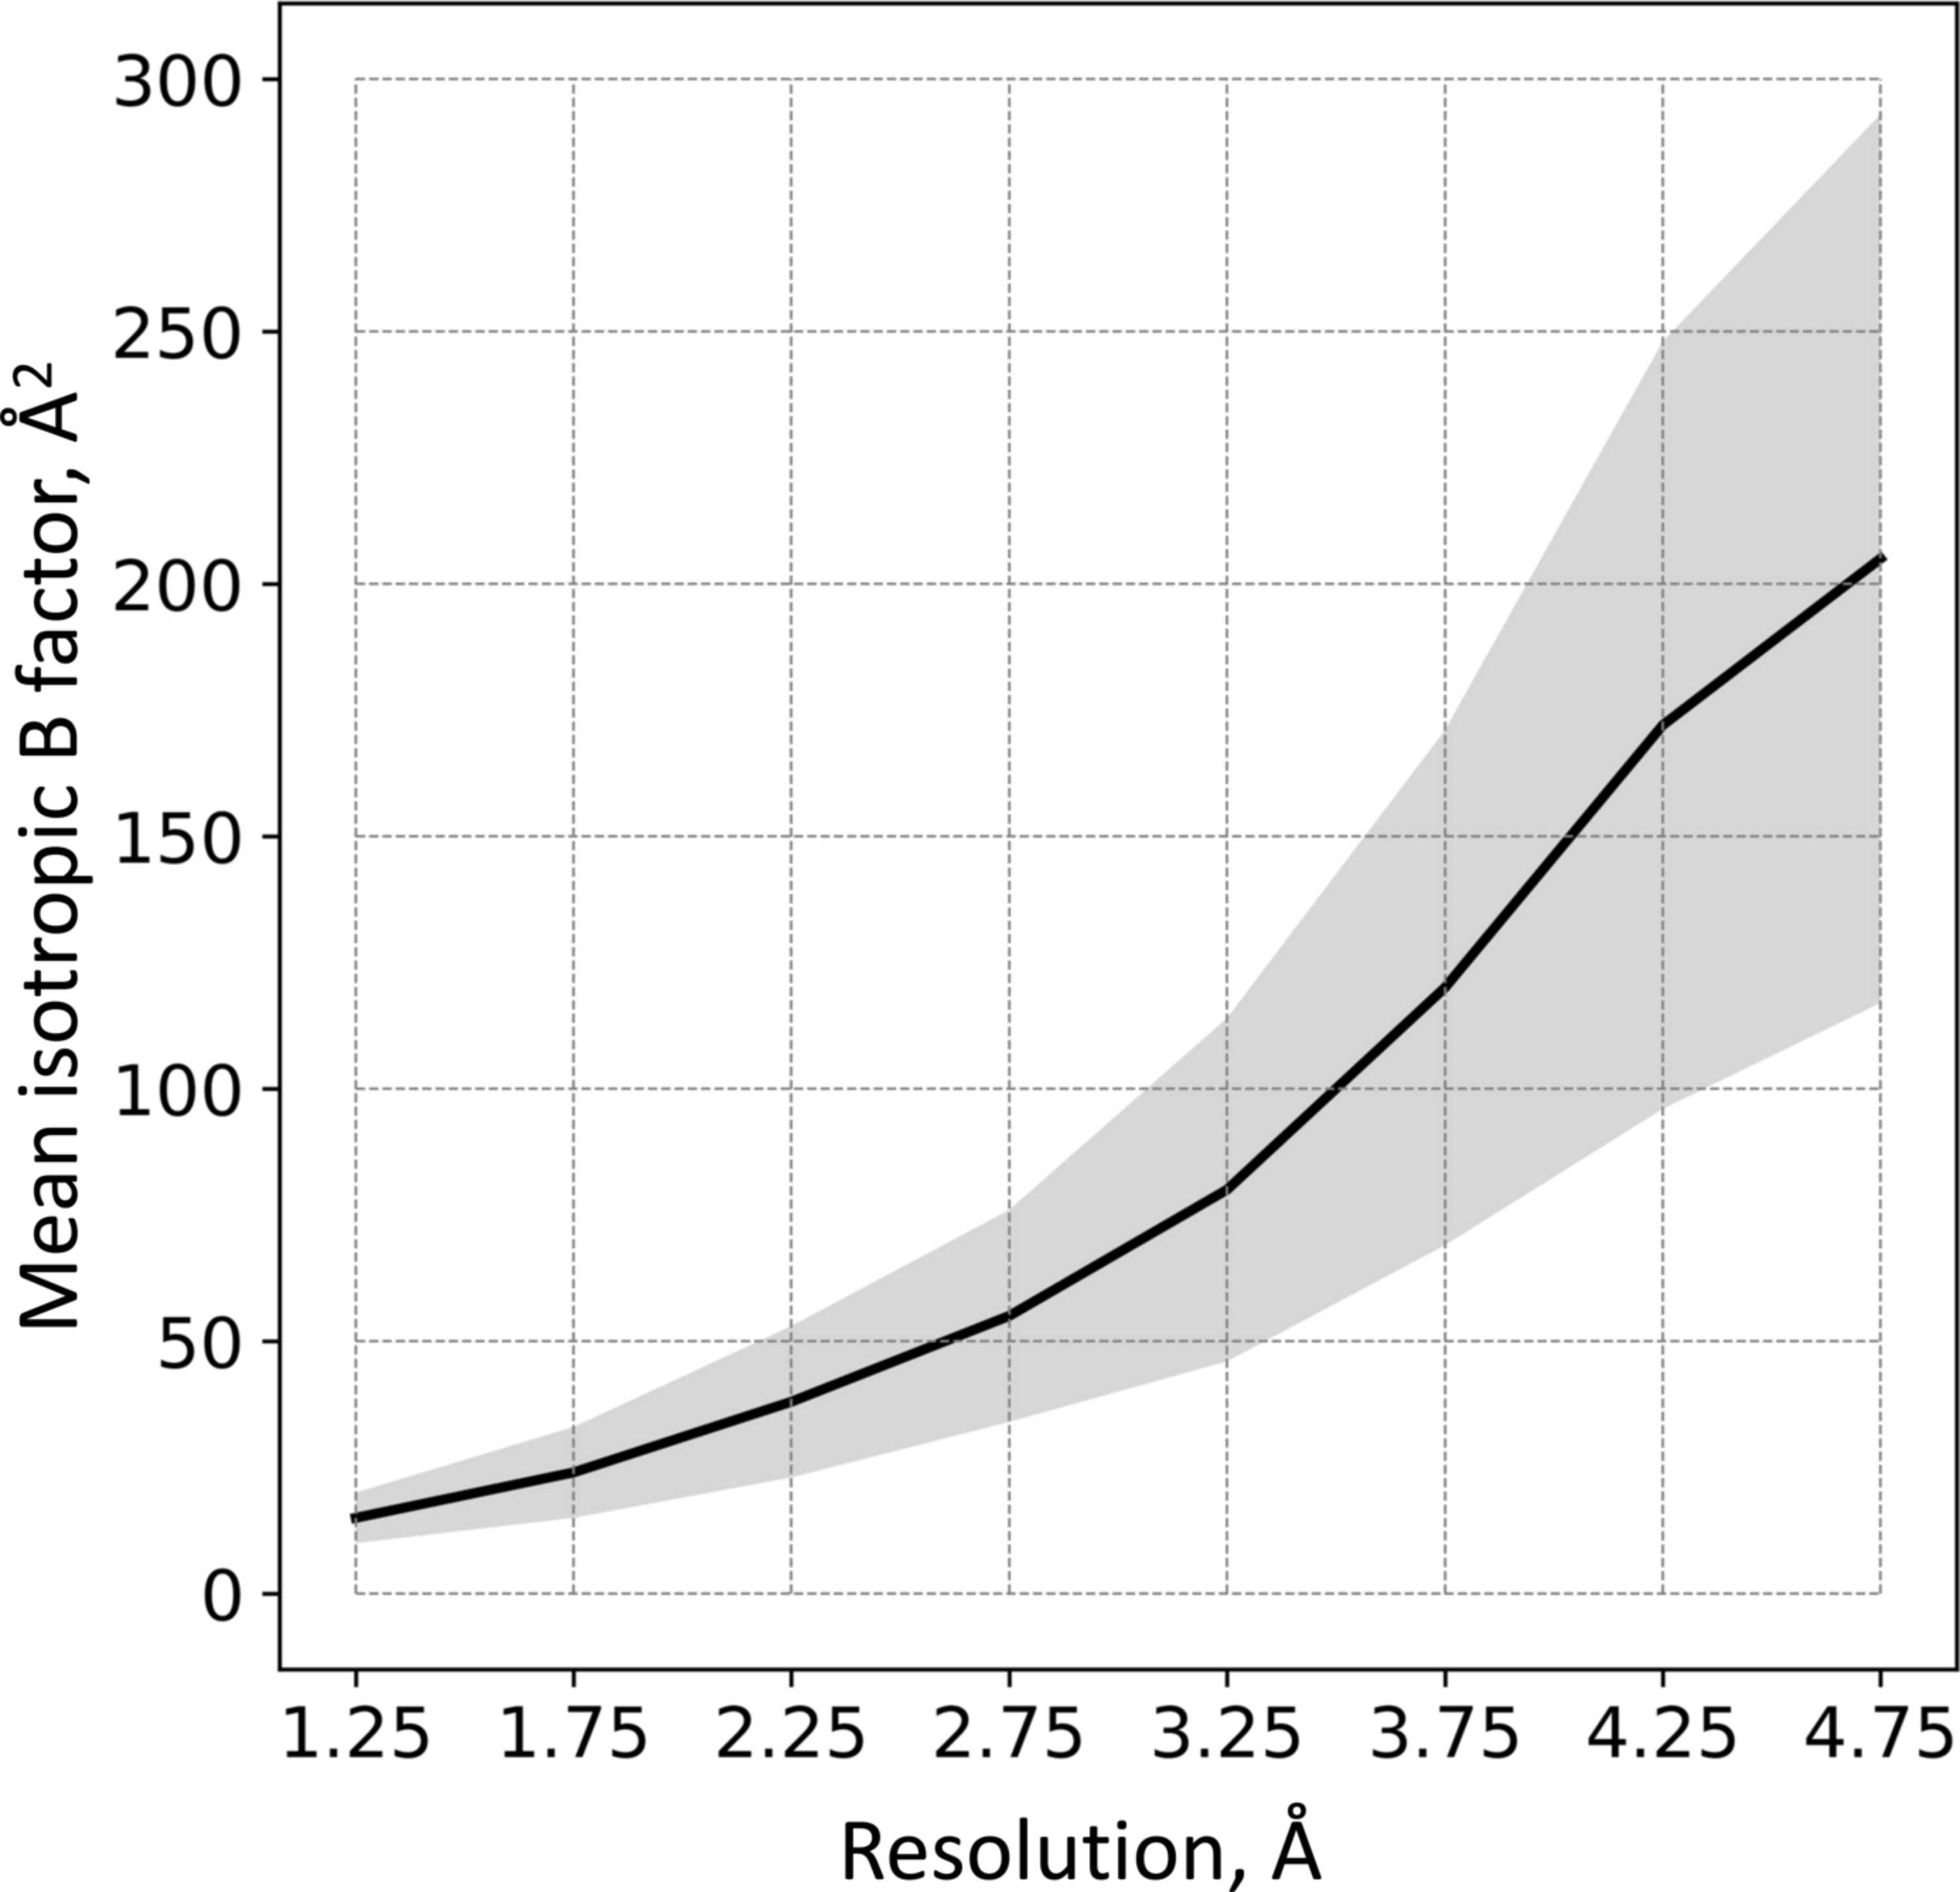
Figure 7
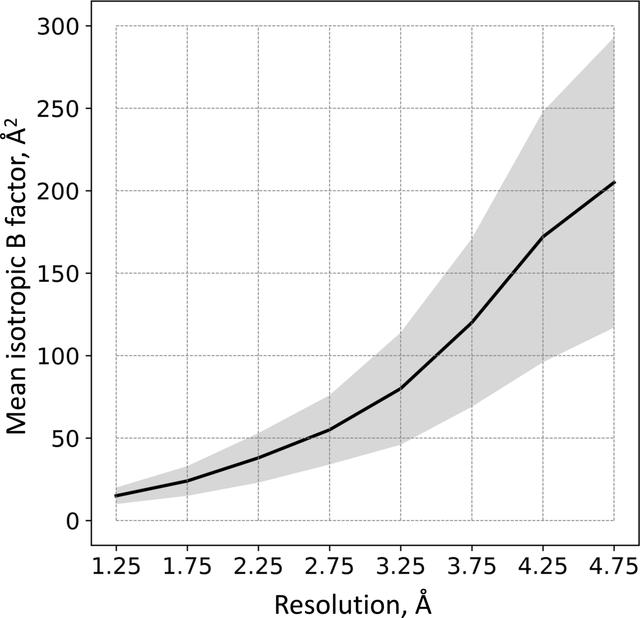
Structure-mean B factor as function of resolution for models in the PDB (black curve). The shaded area shows the standard deviation. Marks on the x axis show midpoints of resolution bins in which averaging of B factors was done: (1, 1.5), (1.5, 2),…, (4.5, 5) Å. |
IUCrJ
ISSN: 2052-2525
CRYO | EM
Open  access