

 menu
|
|
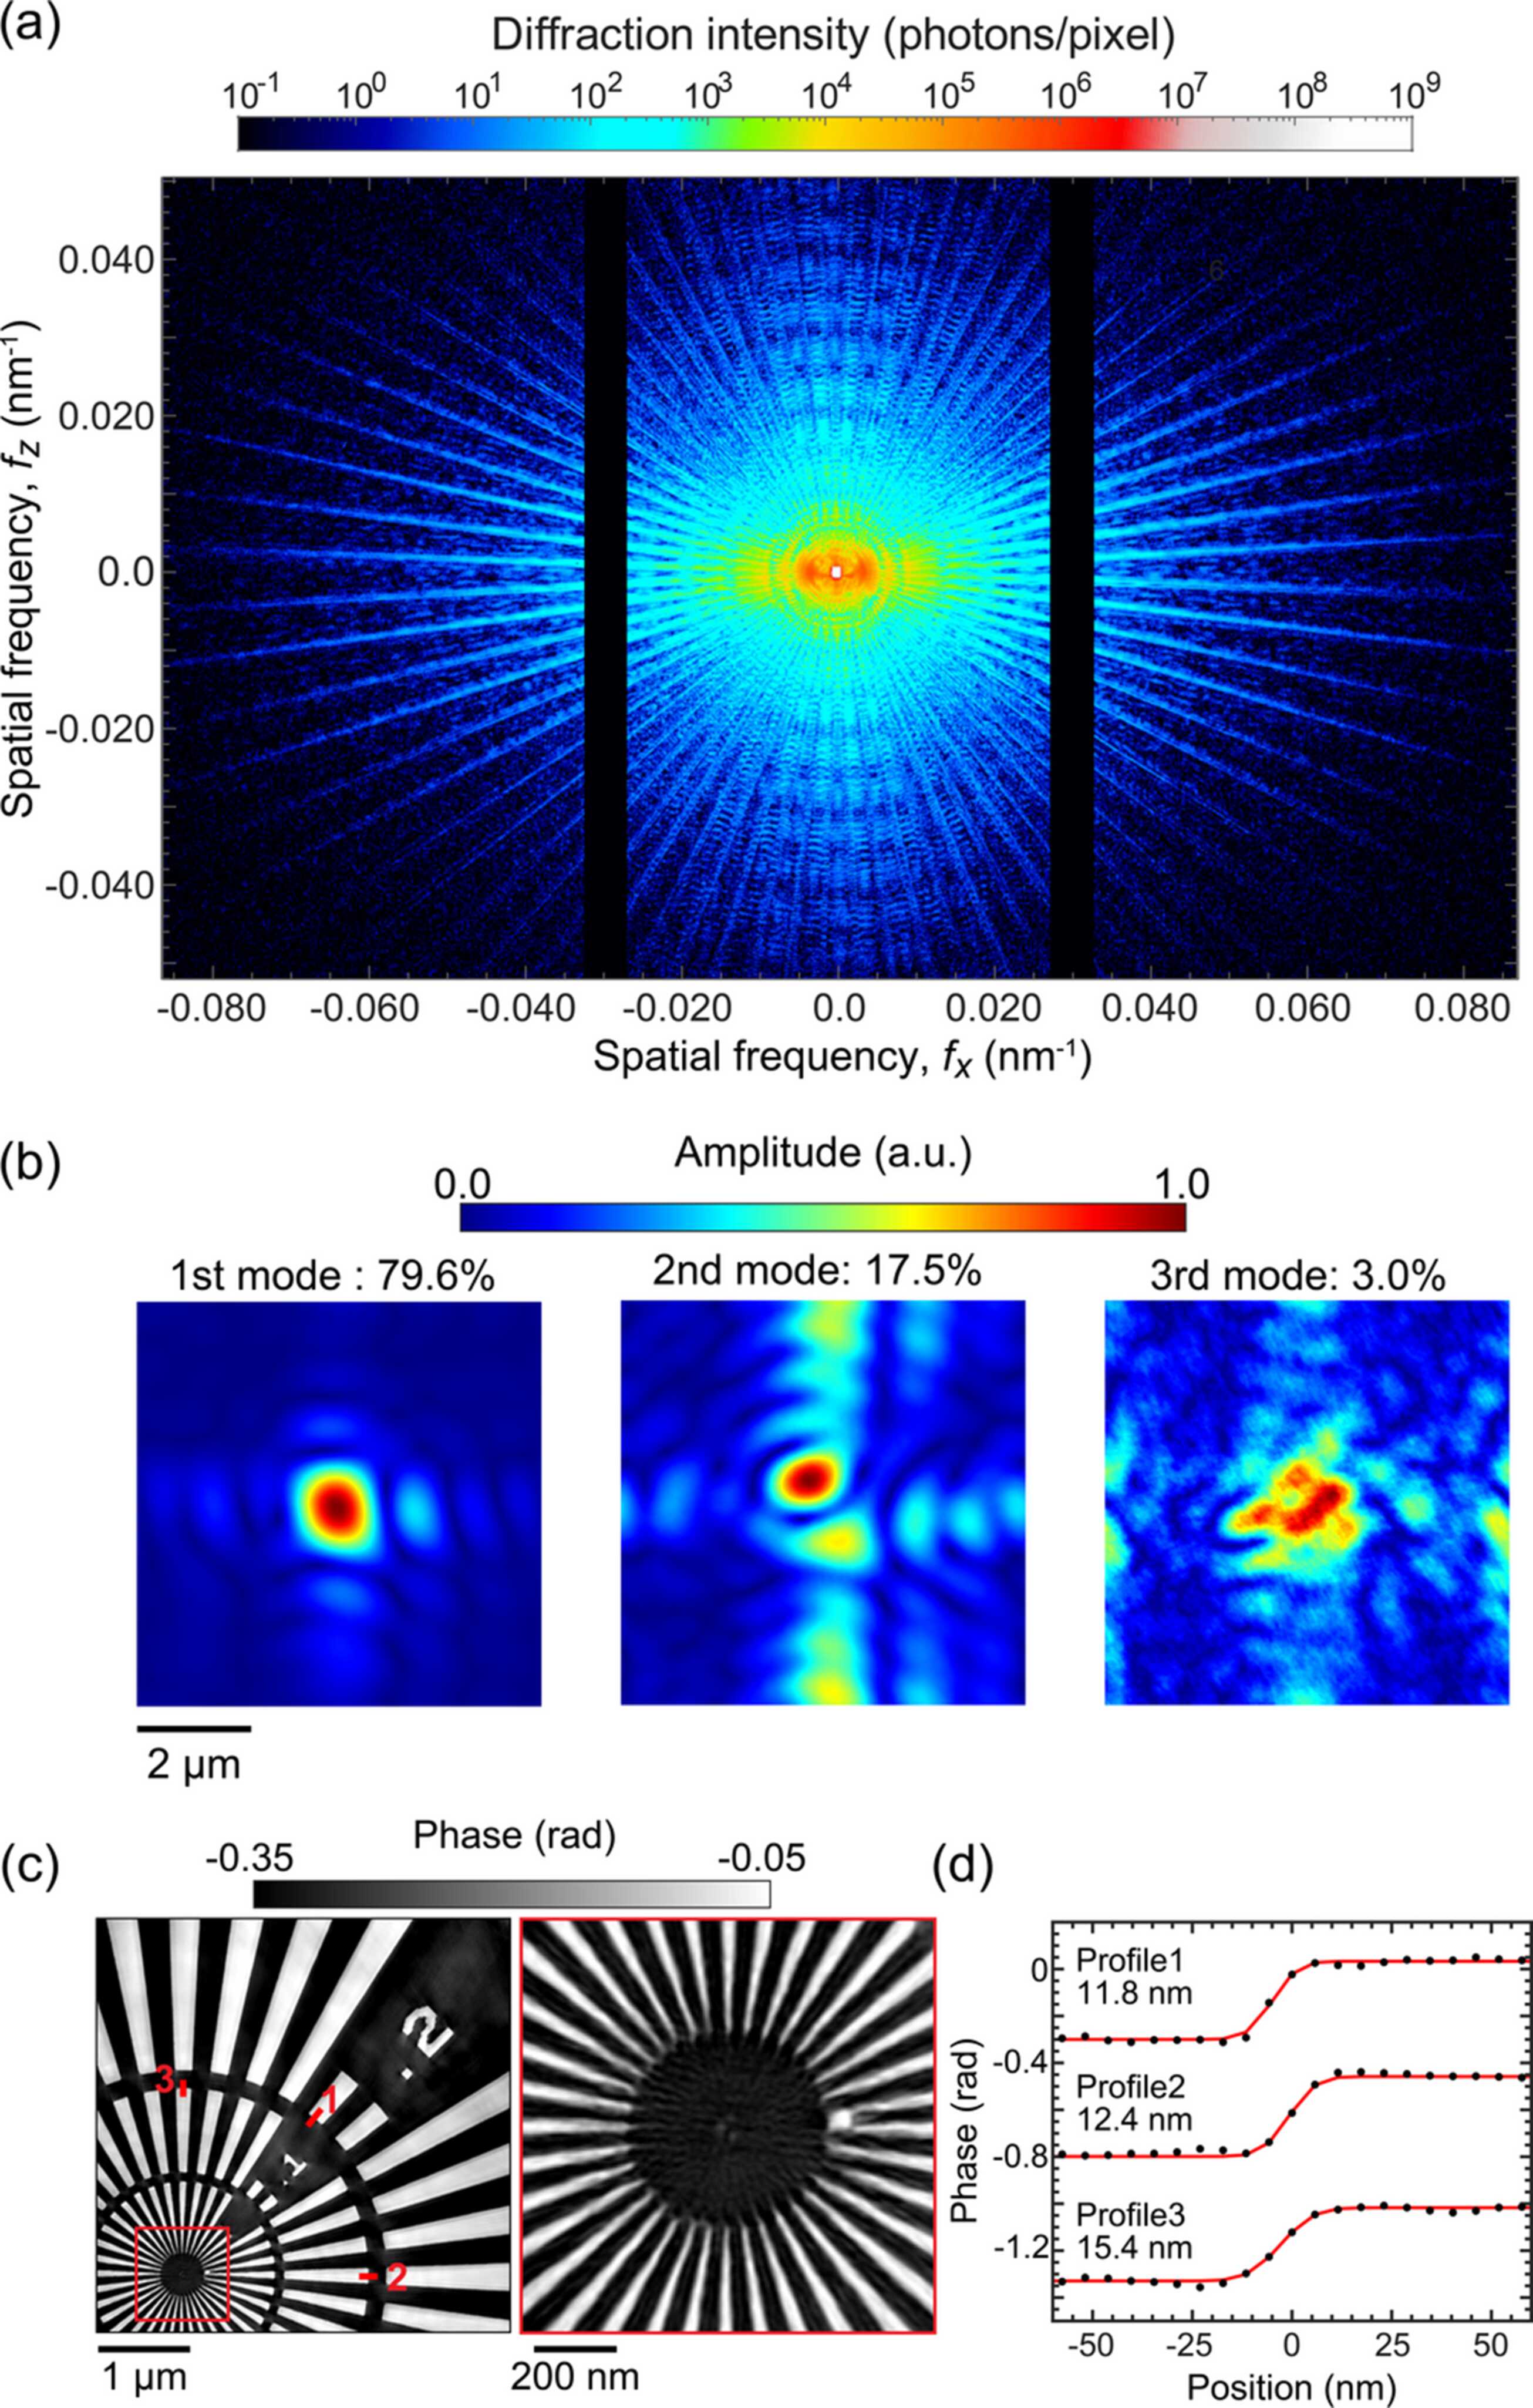
Figure 2
(a) Diffraction pattern of a 100 nm-thick Ta test chart at 4.5 keV. (b) Amplitude image of the reconstructed probe function. (c) Reconstructed phase image of the test chart (left) and magnified view of finest structures (right). (d) Line profile across an edge in the reconstructed phase image and corresponding error-function fit. |
 | JOURNAL OF SYNCHROTRON RADIATION |
ISSN: 1600-5775
 access