

 menu
|
|
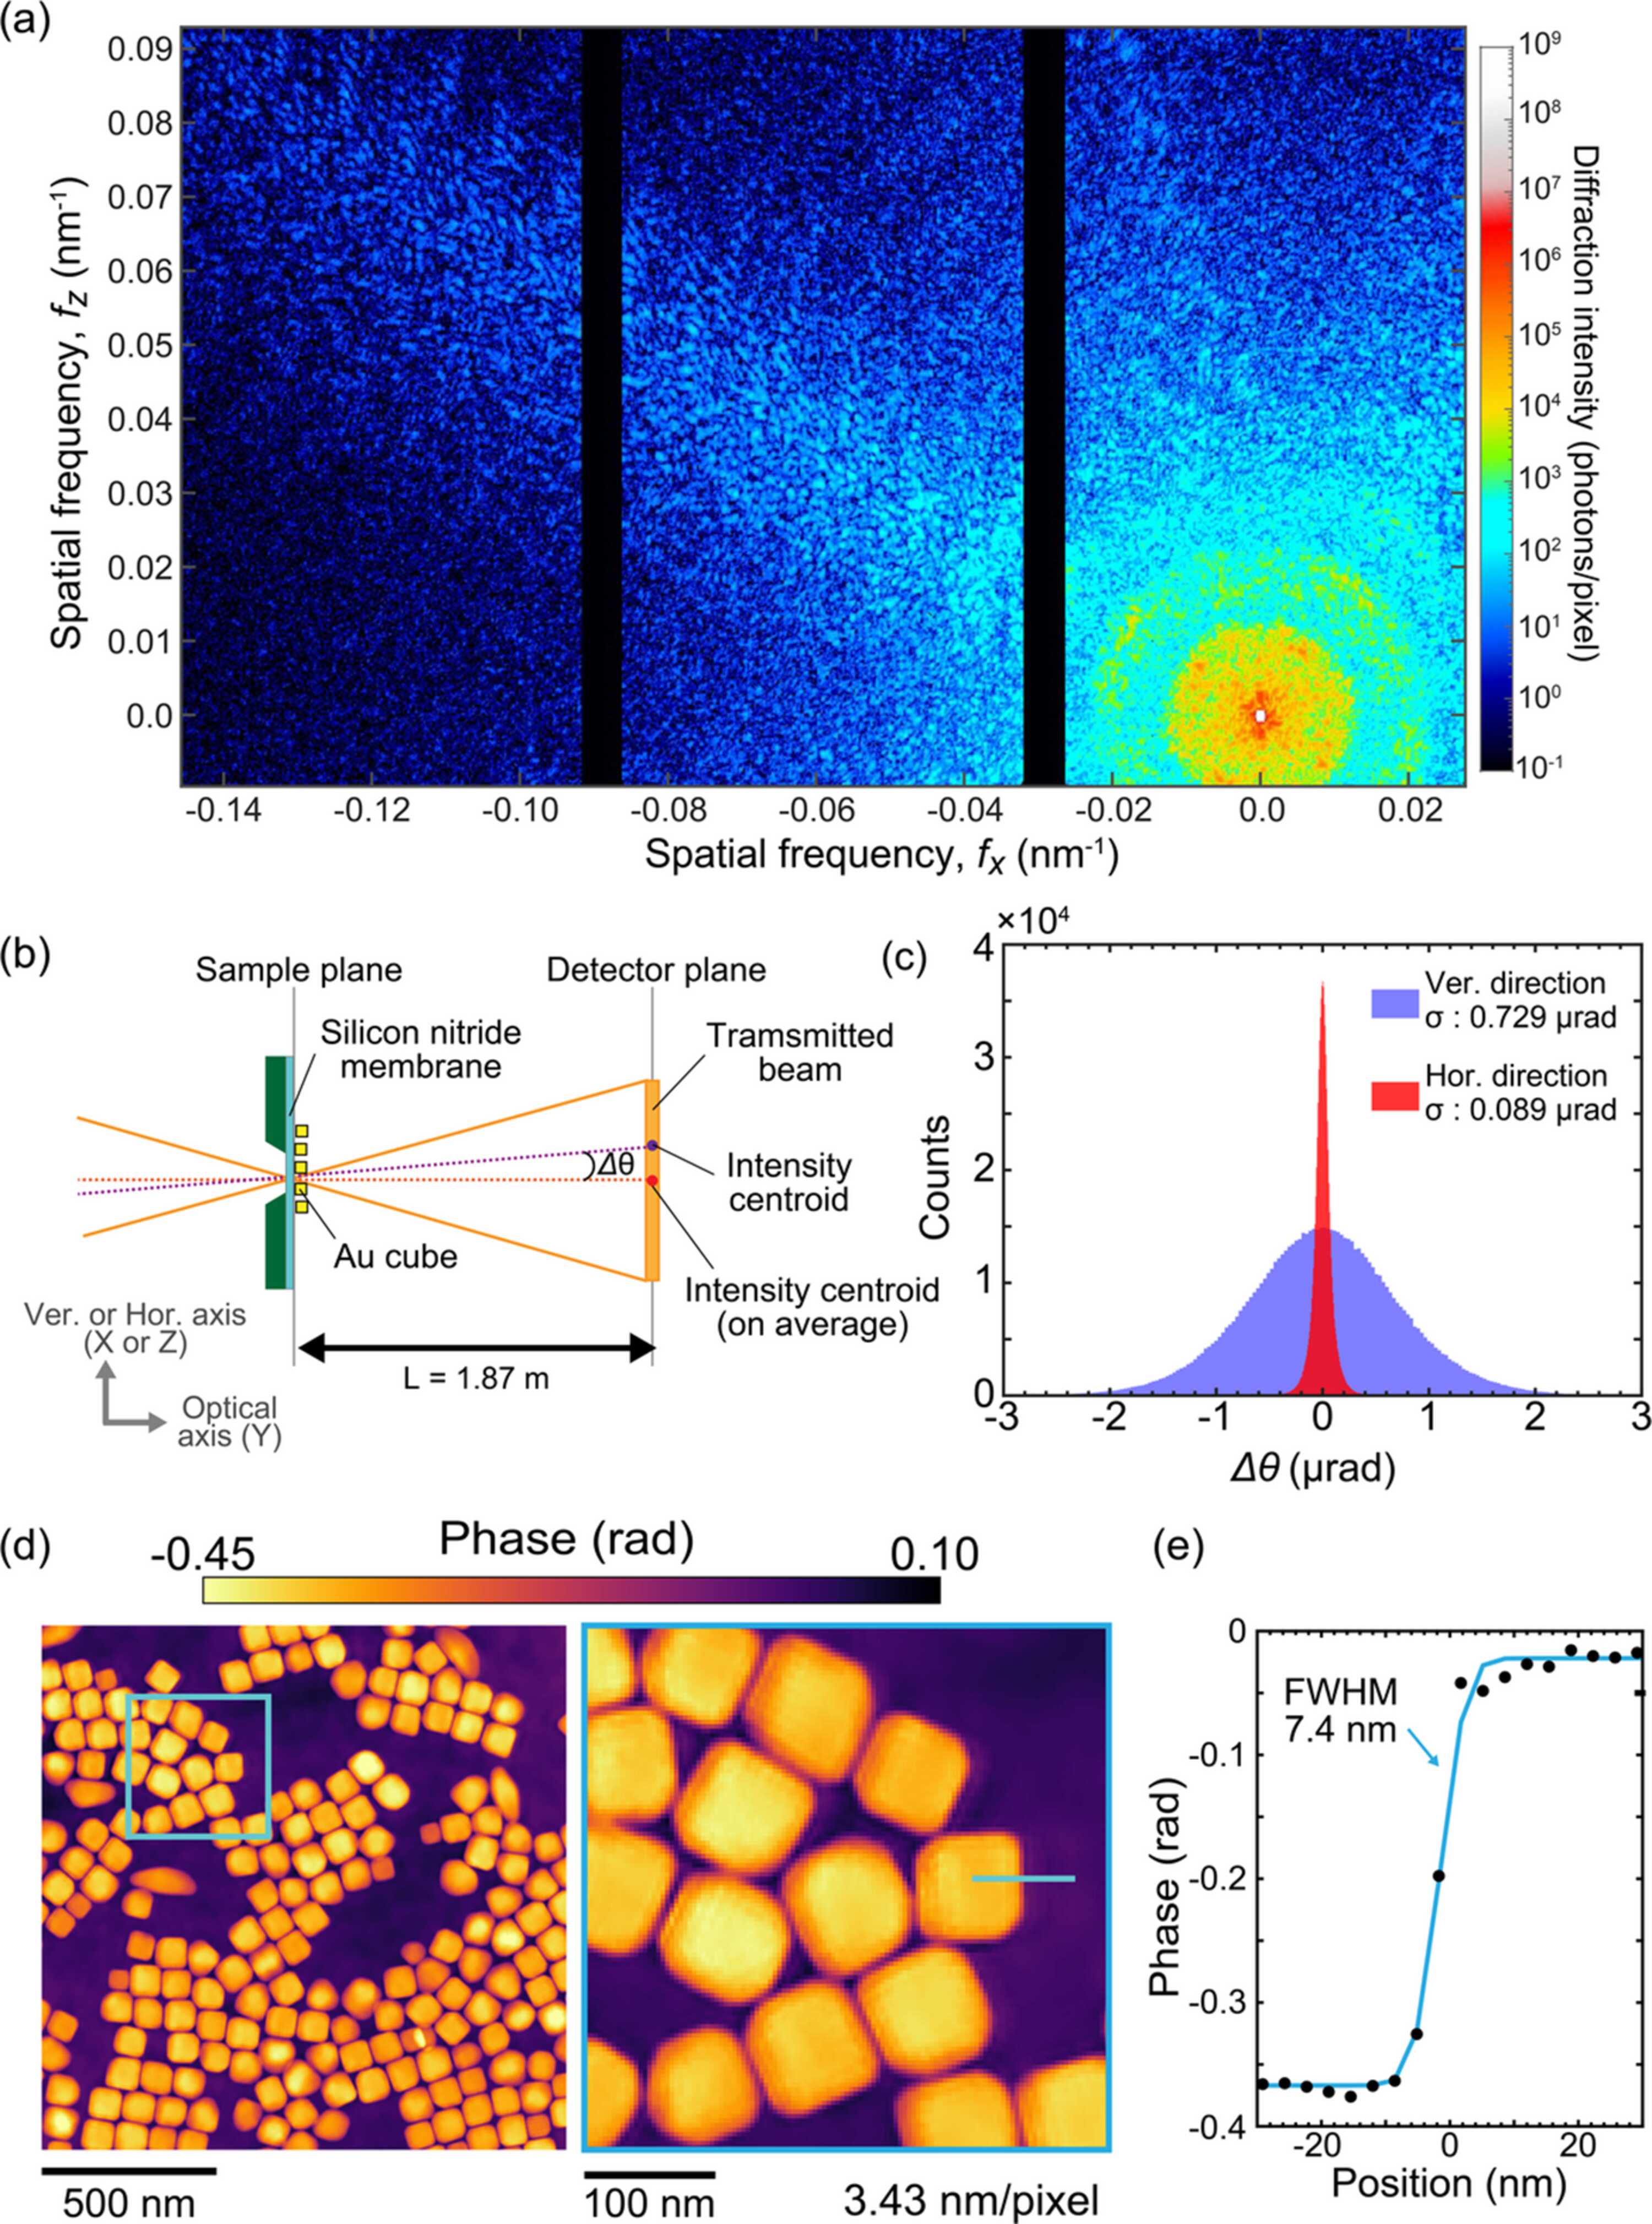
Figure 3
(a) Diffraction pattern of Au nanocubes recorded at 4.5 keV. (b) Schematic of calculation of the wavefront-tilt change from the beam-centroid displacement. (c) Histogram of the wavefront tilt changes, Δθ, evaluated from centroid fluctuations in diffraction intensity patterns. σ is the standard deviation obtained by Gaussian fitting. (d) Reconstructed phase image of Au nanocubes (left) and enlarged view of the boxed region (right). (e) Line profile across an edge in the reconstructed Au-nanocube phase image and corresponding error-function fit. |
 | JOURNAL OF SYNCHROTRON RADIATION |
ISSN: 1600-5775
 access