

 journal menu


research papers
 | JOURNAL OF APPLIED CRYSTALLOGRAPHY |
 access
Tetragonal distortion of the multiferroic compound α-LiFe5O8 from first-principles calculations

aApplied Crystallography and Geomaterials, Department of Earth and Environmental Sciences, Ludwig-Maximilians-Universität München, Theresienstrasse 41C, Munich, Bavaria 80333, Germany
*Correspondence e-mail: [email protected]
The cubic P4332 has been previously reported for the multiferroic lithium ferrite (α-LiFe5O8, denoted LFO). Instead, results from the present study using PBEsol+U calculations with SSSP pseudopotentials suggest that the tetragonal P43212 is true for the ground state of LFO. Spin-resolved projected density of states analysis shows strong 3d electron localization of Fe3+ in FeO4 tetrahedra, mostly contributing to the high Hubbard energy U in the calculated tetragonal model. Its direct band gap of 2.050 eV is slightly lower than that of the cubic model (2.107 eV) in calculations. The calculated ferrimagnetic ground state exhibits a collinear spin order along the crystallographic c axis in the tetragonal magnetic P4321′2′, consistent with the group theoretical prediction. Decreasing ferromagnetic interactions and increasing antiferromagnetic interactions in the c direction, simultaneously, explain the origin of the tetragonality a/c > 1 with a = 8.3528 (2) Å and c = 8.3511 (1) Å. Strong Fe–O–Fe superexchange interactions contribute to the tetragonal lattice distortion of LFO as well.
Keywords: α-LiFe5O8; ferrimagnetic multiferroics; band structure; first-principles calculations; density of states; Hubbard model; density functional theory; magnetic exchange interactions.
1. Introduction
The photovoltaic (PV) effect in magnetoelectric (ME) multiferroics (MFs) has been increasingly investigated by finding spintronics showing helical magnetic spin order-induced electric polarization (Young et al., 2013 ; Xiao et al., 2023; Xu et al., 2021). The bulk PV effect in ME-MFs occurs with photon-excited electrons jumping from the valence band to the conduction band under inherent electric fields in their polar electronic structures due to the magnetic spin order-induced breaking of space inversion (Baltz & Kraut, 1981). Thus, in contrast to p-n-junction semiconductor PVs, the resulting photovoltage in ME-based PVs is barely associated with the band-gap energy (Rangel et al., 2017; Jalaja & Dutta, 2015). In ME-MFs, the coexistence of ferroelectricity and magnetic spin order allows adjustment of their PV performance by applying external magnetic and electric fields. Furthermore, the MF-PV effect can be significantly enhanced by mechanical and chemical stress using thin films and doping (Vopson, 2015; Dharmadhikari & Grannemann, 1982; Ji et al., 2010; Peng et al., 2017; Lee & Son, 2024). Hence, MFs can be photoactive over a wide solar spectrum. In particular, thin films of ME-MFs such as BaTiO3 (Koch et al., 1975), BiFeO3 (Yang et al., 2009) and Bi2FeCrO6 (Mahapatra et al., 2024) have been given attention for PV applications due to their strong response to photons. Their relatively low band gaps of about 2.04–3.21 eV are advantageous compared with those of pure ferroelectric PVs (Nechache et al., 2015; Jalaja & Dutta, 2015). For the bulk PV effect, the photocurrent contributes to the shift current induced by electric polarization, as well as to the ballistic current induced by momentum asymmetry of photon-excited carriers (Burger et al., 2019). Therefore, a low band-gap energy for MFs is desired for strong electron–electron interactions to overcome their photocurrent upper limit of milliamps per square centimetre in contrast to the limit of several thousand amps per square centimetre for semiconductor-based PVs (Jalaja & Dutta, 2015; Huang et al., 2021; Nakamura et al., 2024; Dhass et al., 2020). MF-PVs with a low band-gap energy will be particularly effective for the infrared region from 1.24 meV to 1.7 eV, which is the major part of the solar energy spectrum (Jalaja & Dutta, 2015; Nechache et al., 2015).
Among MFs, the ordered phase of lithium ferrite [α-LiFe5O8 (Liu et al., 2019); LFO hereafter] is interesting for its low band-gap energy depending on preparation: 1.67 and 1.86 eV for nest-like crystallites with and without using a reduced graphene oxide substrate, respectively (Zhang & Zhang, 2016), 2.37 eV for a nanocrystalline film on a glass substrate (Babrekar & Jadhav, 2017), and 1.40–1.60 eV for mixed nanoparticles of α-LiFe5O8 and β-LiFe5O8 calcined between 973 and 673 K (Chireh & Naseri, 2019). On the other hand, it is desirable to introduce a high ME coupling effect into multiferroics, preferably at room temperature for PV applications. In this sense, LFO is interesting for its high ME coupling coefficient (αME) value of 2 mV Oe−1 cm−1 at 120 K; its αME value decreases with increasing temperature (0.2 mV Oe−1 cm−1 at 250 K), but the ME effect in LFO does exist up to room temperature (Liu et al., 2019). The ferrimagnetic state of LFO is stable below its high Curie temperature of 907 K (Astafyev et al., 2019), exhibiting a saturation magnetization of 2.5 μB per formula unit at room temperature (Pachauri et al., 2015). This significant effective ME effect in LFO is attributed to the spin–orbital (SO) coupling of Fe3+ (3d5) residing in geometrically distorted octahedra (Mohapatra & Dobbidi, 2023). The resulting polyhedral distortion-induced electric polarization in a weak ferromagnetism (Mercier et al., 1977) can be tuned by various external fields (Liu et al., 2019).
LFO has been intensively investigated in both research and development of functional materials (Iliev et al., 2011; De Picciotto & Thackeray, 1986; Gridnev et al., 1997; Kinoshita et al., 2016; Teixeira et al., 2021; Soreto et al., 2017; Kumawat et al., 2021; Kim et al., 2022; Sousa et al., 2019; Moore et al., 2024; Tan et al., 2021). All these experimental and theoretical studies of LFO have been based on the atomic arrangements in the cubic space group P4332 (Liu et al., 2019). Its point group 432 is not a polar group and hence it disallows spontaneous electric polarization but allows the second-order ME effect. There are several unclear issues about its cubic space-group symmetry P4332 and the consequent magnetic spin order in the cubic lattice (Kumawat et al., 2021; Liu et al., 2019). In particular, several strong magnetic Bragg reflections forbidden to its ferrimagnetic order in the cubic magnetic space group P4332 were excluded in Rietveld refinements using high-resolution neutron powder diffraction (HRNPD) data (Kumawat et al., 2021). By coincidence, the resulting collinear ferrimagnetic spin order is consistent with a theoretical magnetic spin order along the c axis predicted from ab initio calculations, where only the cubic P4332 was considered (Kim et al., 2022). However, according to the group–subgroup relation between space group and magnetic space group in group theory, the collinear spin arrangement is best realized in the tetragonal magnetic space group P43 2′, the same as the ferrimagnetic structure of Al3+-doped LFO-type compounds in our recent HRNPD study (Inckemann et al., 2025).
To date, there are no experimental band-gap energy data for LFO samples without microstructural effects. Results from previous density functional theory (DFT) calculations on LFO by different researchers are also contradictory to each other as they reported different band-gap energy values: Sousa et al. (2019) did not consider short-range interactions between localized Fe 3d electrons, giving rise to unreasonable characteristics for LFO and an overestimated indirect band gap of 2.3 eV. Kim et al. (2022) calculated structural, electronic and magnetic properties of LFO in combination with the Hubbard model, resulting in a collinear ferrimagnetic spin configuration with a indirect band gap of 1.99 eV. However, in their DFT calculations, the Hubbard value U for the on-site Coulomb correction was determined merely by fitting the cubic lattice constant, rather than using the linear response method regarded as the standard way for obtaining U values (Moore et al., 2024). For this reason, the underestimated interaction between Fe 3d electrons might be corrected further. According to the simulations done by Tan et al. (2021), the U value was set at 5.3 eV, where the maximum was higher than the level. This could not be explained in terms of semiconductor behaviour. Thus, it is necessary to re-examine the true atomic and magnetic structures of LFO, which involves a symmetry lowering from cubic to tetragonal. The present study is an extensive re-investigation of the electronic structures of LFO in both cubic and tetragonal models using the DFT method with the Hubbard model. The simulated atomic and magnetic structures, as well as the electronic properties, agree with the tetragonal P43212 being true for LFO, as described in the following.
2. Starting models
Following previous experimental and theoretical studies of LFO (Kim et al., 2022; Kumawat et al., 2021), we have taken a collinear ferrimagnetic spin configuration of Fe3+ in the tetragonal and octahedral sublattices in two starting models:
(i) The well known cubic model in P4332. Li+ is located on an octahedral site (4b) while Fe3+ is found on both octahedral (12d) and tetrahedral (8c) sites. The respective Fe sites are labelled Fe1 and Fe2 [Fig. 1(a)].
![[Figure 1]](po5178fig1thm.gif) | Figure 1 Initial models of α-LiFe5O8, (a) in P4332 and (b) in P43212 with site splitting for DFT simulation. For both starting models, a collinear ferrimagnetic spin order is configured with two sublattices of Fe3+ in FeO4 and FeO6 polyhedra. |
(ii) The tetragonal model in P43212, a direct subgroup of P4332. Its magnetic subgroup P432′ is the only possible one to allow a collinear ferrimagnetic arrangement along c among the cubic (P 32′ and P4332) and tetragonal (P432′, P2, P212′ and P43212) magnetic subgroups of P4332 [see the supporting information of Inckemann et al. (2025)]. This tetragonal distortion is accompanied by splitting on the Fe1 and O2 sites, i.e. the octahedral site for Fe (12d) and the site for O (24e) in the cubic model are split into Fe1a (8b) + Fe1b (4a) and O2a (8b) + O2b (8b) + O2c (8b), respectively, in the tetragonal model [Fig. 1(b)].
Using all the atomic parameters including magnetic moments, U values were fitted for all Fe3+ ions for both models. To prove the difference between the ferri- [Fig. 2(a)] and ferromagnetic [Fig. 2(b)] ground states, we calculated their total energies.
![[Figure 2]](po5178fig2thm.gif) | Figure 2 Two theoretical (a) ferrimagnetic and (b) ferromagnetic arrangements of Fe3+ in the starting models for the ground state of α-LiFe5O8 in P43212. |
3. Computational methods
DFT, based on the electron density and exchange-correlation approximations, explains the behaviour of the electrons and atomic nuclei of the investigated system by solving the Kohn–Sham equation without any experimental data (Bagayoko, 2014). As a reliable first-principles calculation method, DFT has contributed greatly to predicting and explaining coupling effects in various types of multiferroic materials beyond their structural and electronic properties (Neaton et al., 2005; Ederer & Spaldin, 2006). Combined with the first-order perturbation theory, the density functional perturbation theory (DFPT) allows the simulation, with high computational efficiency, of crystal systems with a localized perturbation in one unit cell without requiring a supercell (Baroni et al., 2001).
In the present study, for the multiferroic state of LFO, the magnetic spin of Fe3+ has been considered with the valence electronic configurations of Fe (3p63d54s2), Li (1s22s1) and O (2s22p4). All Fe3+ species in LFO exhibit the high-spin state (S = 5/2). Strong correlations between the Fe 3d electrons were described by the Hubbard model. The DFPT+U method was applied to correct the on-site Coulomb interaction U and spin polarization (Anisimov et al., 1991), where U describes the of a 3d5 electron. In Hubbard-corrected DFPT calculations, the total energy of a spinel EDFPT+U is given by the sum of the energy without spins (EDFPT) plus the energy of the on-site Coulomb correction term with a spin contribution (EU),

In order to determine U, DFPT calculations with the first-order linear-response theory in reciprocal space were self-consistently performed by the HP code (Timrov et al., 2022). The convergence threshold for the response functions was set to 1 × 10⁻⁶ eV−1.
With the corrected U values, DFT calculations were executed using the Quantum ESPRESSO software suite (Giannozzi et al., 2009; Giannozzi et al., 2017) with the standard solid-state pseudopotentials (SSSP) (Version 1.3.0; Prandini et al., 2018). Using the Perdew–Burke–Ernzerhof (PBE) (Perdew et al., 1996) method for the generalized gradient approximation, exchange-correlation functionals were implemented to optimize the lattice metric and atomic parameters, and subsequently to calculate band structures. The lattice parameters are strongly related to magnetic properties, such as magnetic exchange interactions. Hence, we applied the PBEsol method to DFT calculations to improve the accuracy of the lattice parameters (Perdew et al., 2008). The kinetic energy cutoff for wavefunctions was tested and could be set to 100 Ry. According to the Monkhorst–Pack scheme, the k-point meshes in the Brillouin zone were sampled by 5 × 5 × 5 grids for both cubic and tetragonal unit cells of LFO. The total energy convergence criterion of 1 × 10⁻⁶ Ry and the forces convergence threshold of 1 × 10⁻⁴ Ry per Bohr were parameterized. The charge density cutoff of 1100 Ry was set when using SSSP to describe details in orbital electronic structures near the iron nucleus (Prandini et al., 2018).
To explain the origin of tetragonality for LFO, magnetic exchange interactions were calculated with the Green function method according to Liechtenstein–Katsnelson–Antropov–Gubanov (LKAG) (Liechtenstein et al., 1987). For a classical Heisenberg model, the Hamiltonian is described as

Jij is an exchange interaction between two magnetic moments on sites i and j; and si and sj are the unit vectors pointing in the direction on sites i and j, respectively. The magnetic exchange parameters were calculated on the basis of the magnetic force theorem, while the change in electronic single-particle energies of the system was related to the perturbation in the magnetic spin subsystem. Accordingly, the exchange parameters Jij could be described by the intersite Green functions. In DFT calculations, plane-wave-based methods were used to obtain electronic band structures with Bloch states. The resulting Bloch states wavefunctions were projected onto a localized basis (Wannier functions) using the Wannier90 code (Pizzi et al., 2020) for calculating Jij, where Wannier functions construct the effective Hamiltonian and give the intersite Green functions. Finally, the magnetic exchange parameters in real space were obtained from DFT calculations using the TB2J package (He et al., 2021).
4. Results and discussion
4.1. Assessing the ground-state structures and on-site Hubbard parameters
The Hubbard U values were calculated on the tetrahedrally and octahedrally coordinated sites for Fe3+ in P4332 and P43212. The calculated U values between 5.0308 and 5.1668 eV from both SSSP+PBE (Table A.I in the supporting information) and SSSP+PBEsol (Table 1) methods agree with those typical for Fe3+ in various iron compounds (Moore et al., 2024). Overall, as demonstrated in Fig. 3, the U values from the two methods are close to each other after the fourth iteration. The U values of Fe3+ in the tetragonal lattice in P43212 are larger than those in the cubic lattice in P4332, and this is especially significant on the tetrahedral site Fe2. Furthermore, this on-site Coulomb repulsion on Fe2 (U = 5.1668 eV) is stronger than those on the octahedral sites Fe1a (U = 5.0724 eV) and Fe1b (U = 5.0839 eV). This implies more localized Fe 3d electrons in FeO4 tetrahedra, particularly in the tetragonally distorted lattice (Table 1).
| |||||||||||||||||||||||||||||||||||||||||||||||||||||||||||||||||||||||||||||||||||||||||||||||||||||||||||||||||||||||||||||||||||||||||||||||||||||||||||||||||||||||||||||||||||||||||||||||
![[Figure 3]](po5178fig3thm.gif) | Figure 3 Hubbard values (U) calculated in this study for the cubic and tetragonal models of LFO in each iteration step. |
From DFT calculations with the U values from both SSSP+PBE (Table A.I in the supporting information) and SSSP+PBEsol (Table 1) methods, the magnitudes of the total energy E for the cubic and tetragonal models were computed as a function of the unit-cell volume V, as shown in Fig. 4. The ground-state unit-cell volume (V0) and its total energy (E0) were estimated by least-squares fitting of the E–V curve in the third-order Birch–Murnaghan equation of state (EOS) (Birch, 1947),
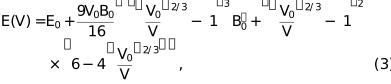
where B0 is the ground-state bulk modulus and  is the derivative of the bulk modulus against pressure. After four iteration steps of the geometry optimization, the value for V0 tends toward convergence, particularly by applying SSSP pseudopotentials with PBEsol exchange-correlation functionals (Fig. 4). The obtained V0 values of 583.2293 (3) and 582.6501 (3) Å3 for the cubic and tetragonal models, respectively, are comparable to experimental results, e.g. Vexp = 578.01 Å3 at room temperature for the cubic model (Liu et al., 2019), while for the tetragonal model (our own work, to be published elsewhere), we obtained Vexp = 578.19 (2) Å3 at room temperature using X-ray single-crystal diffraction and Vexp = 576.49 (1) Å3 at 3 K by Rietveld analysis with HRNPD data. There is an extremely small difference of 0.1% in the V0 values between the tetragonal and cubic models, where the former with a > c is relatively close to Vexp values. In comparison, the V0 values from the SSSP+PBE method are much further from these experimental observations, as clearly seen in Fig. 4. The current study shows that the PBEsol exchange-correlation functional is suitable for calculating the ground-state unit-cell volume V0. Thus, we consider exclusively the results from the SSSP+PBEsol method hereafter. For the same reason, we employed the U values obtained using the SSSP+PBEsol method in the subsequent calculations of electronic band structures and magnetic interaction parameters (Sections 4.2 and 4.3).
![[Figure 4]](po5178fig4thm.gif) | Figure 4 V0 values (triangles) calculated in this study for the cubic and tetragonal models of LFO in each iteration step. The volumes of LFO in the cubic reported by other experimental [filled star: Liu et al. (2019 ); open star: our work] and theoretical [pentagon: Tan et al. (2021)] studies are given for comparison. |
The atomic positions were relaxed by geometry optimization iterations using the PBEsol method. The optimized structure parameters, bulk moduli and total energies are listed in Table 1. The tetragonal model of LFO shows an insignificantly lower total energy than the cubic model, i.e. a difference of 5 × 10⁻⁴ Ry, but with a high accuracy of 10−9 Ry. On the other hand, our calculations of the respective total energies −7911.0057 and −7910.4706 Ry for the respective ferri- and ferromagnetic orders in the tetragonal lattice (Fig. 2) point to the ferrimagnetic ground state in the tetragonal structure of LFO. As mentioned above, this ground-state ferrimagnetic spin order cannot be realized in the cubic magnetic subgroups of P4332; the collinear ferrimagnetic spin arrangements along the crystallographic c axis are allowed exclusively in the tetragonal magnetic P432′ (Inckemann et al., 2025). Hence, a reasonable conclusion can be drawn that LFO undergoes a slight tetragonal lattice distortion. This is highly possible due to the magnetic origin, i.e. the small tetragonality [a = 8.3528 (2) Å, c = 8.3511 (1) Å] may arise from weak antiferromagnetic interactions between the tetragonal and octahedral sublattices of Fe3+, which compete with the ferromagnetic interactions within each sublattice (Fig. 2). This issue is addressed quantitatively in Section 4.3. The bulk modulus of 166.20 GPa calculated by the PBEsol method for the tetragonal model is consistent with the experimental value reported by Massoudi et al. (2020) as well. Overall, the current study suggests the ground-state structure of LFO is tetragonal in P43212. This finding was applied in the subsequent calculations of band structures in Section 4.2 and magnetic interactions in Section 4.3.
Comparing the local structures of LiO6, FeO6 and FeO4 polyhedra (Fig. 5), their volumes, geometric degrees of distortion and distortion-induced electric dipole moments were evaluated using the best-fitted idealized polyhedron method (Song & Liu, 2019; Song et al., 2023) (Table 2). Their degrees of polyhedral distortion and distortion-induced electric dipole moments (Fig. 5) show noticeable differences between the two models within calculation uncertainties (Table 2). In the tetragonal model, the small volume of FeO4 with obviously short Fe—O bonding distances (Tables A.I and A.II) reflects strong interactions between Fe on Fe2 with four ligand oxygens. The electric dipole moment modulus of FeO4 is negligibly small compared with those of highly distorted FeO6, particularly on Fe1b. The shrinkage in FeO4 tetrahedra in the tetragonal model is consistent with the higher U value on Fe2 compared with that in the cubic lattice. This hints at the presence of competing interactions, such as between O 2p and Fe 3d orbitals in a rigid and small FeO4 unit in the tetragonal ground state of LFO (see Section 4.2). The significantly different degrees of distortion between Fe1aO6 and Fe1bO6 [Fig. 5(b)] are a strong sign for lattice distortion towards a tetragonal lattice. Otherwise, in the cubic structure model, there may not be any differences between these two octahedra.
| |||||||||||||||||||||||||||||||||||||||||||||||||||||||||||||||||||||||||||||||||||||||||||||||||||||
![[Figure 5]](po5178fig5thm.gif) | Figure 5 Polyhedral distortion-induced electric dipole moments (Table 2 ) are indicated by bold red arrows, (a) in the cubic model in P4332 and (b) in the tetragonal model in P43212. Both models were simulated by the PBEsol method. |
4.2. Electronic band structures and density of states
The electronic band structures were calculated using the optimized structural and Hubbard parameters from self-consistent DFT calculations in both cubic and tetragonal models. The spin-up and spin-down states were calculated along the high-symmetry paths in R(0.5, 0.5, 0.5) → Γ(0, 0, 0) → X(0.5, 0, 0) → M(0.5, 0.5, 0) → Γ(0, 0, 0) in P4332 and Γ(0, 0, 0) → X(0, 0.5, 0) → M(0.5, 0.5, 0) → Γ(0, 0, 0) → Z(0, 0, 0.5) → R(0, 0.5, 0.5) → A(0.5, 0.5, 0.5) in P43212. The spin-up state in the octahedral sublattice (denoted the B sublattice) was set to |↑〉, while the spin-down state in the tetrahedral (denoted the A sublattice) was set to |↓〉, and then the electronic band gaps were calculated. The reverse configurations were also calculated (Fig. 6).
![[Figure 6]](po5178fig6thm.gif) | Figure 6 Electronic band structures of LFO along the high-symmetry paths: (a) |↑〉 on Fe1 and |↓〉 on Fe2 in the cubic model, (b) |↑〉 on Fe2 and |↓〉 on Fe1 in the cubic model, (c) |↑〉 on Fe1a and Fe1b and |↓〉 on Fe2 in the tetragonal model, and (d) |↑〉 on Fe2 and |↓〉 on Fe1a and Fe1b in the tetragonal model. The dashed lines at 0 eV indicate the Spin-up and spin-down electrons are shown in red and blue, respectively. |
Regarding the B their band structures for two reverse |↑〉 [Figs. 6(a) and 6(c)] and |↓〉 [Figs. 6(b) and 6(d)] states show direct band gaps. Our results do not agree with an indirect band-gap energy calculated for the spin-up state of Fe3+ in the octahedral B in a previous DFT study (Kim et al., 2022). The DFT calculations performed in the present study clearly show direct band gaps for these two different ferrimagnetic spin configurations. Their identical magnitudes can be understood by the intrinsic symmetry of the spin-polarized Hamiltonian. These two magnetic states, which are the reverse of each other, belong to the same energetic and electronic solution for a collinear spin alignment in the DFT calculations, and are related by a global spin-flip symmetry. This results in a physically equivalent charge-density distribution. Therefore, in the subsequent calculations, we focused on the one case with |↑〉 in the B and |↓〉 in the A The direct band-gap energy of 2.050 eV for the tetragonal model in P43212 is slightly narrower than the value of 2.107 eV for the cubic model in P4332. These band gaps calculated for the microstructure-free LFO crystalline structure are larger than the band-gap energy measured on nest-like crystallites of LFO (about 1.9 eV; Zhang & Zhang, 2016) and the direct band gap probed with LFO nanoparticles (1.6 eV; Chireh & Naseri, 2019; Li et al., 2020).
The spin-resolved projected density of states (PDOS) on each atomic site in the cubic and tetragonal models for LFO are graphically summarized in Fig. 7. The total DOS indicates the following:
![[Figure 7]](po5178fig7thm.gif) | Figure 7 PDOS on all atomic sites of LFO, (a) in P4332 and (b) in P43212. The spin-up electron states are above 0 eV in the PDOS, while the spin-down electron states are below 0 eV. The Fermi energy levels are indicated with vertical dotted lines. |
(i) There is a strong between O 2p and Fe 3d orbitals in the valence bands. This is profound for the tetragonal model.
(ii) The conduction bands predominantly contribute to Fe 3d states. In particular, the conduction-band minimum is determined by the edge of the Fe 3d orbitals near the The spin-up electrons mainly originate from tetrahedral Fe sites, whereas the spin-down electrons are associated with octahedral Fe sites. A noticeable contribution of O 2p to these spin states is also seen in the total DOS.
(iii) The PDOS profiles on sites Fe1a and Fe1b in the tetragonal model differ from each other. This accords with the symmetry splitting with respect to the Fe1 site in the cubic model. The total DOS in the tetragonal model shows that the conduction-band minimum is predominantly contributed to by Fe 3d on the octahedral sites Fe1a and Fe1b. The minimum energy level of Fe 3d on Fe2 is much further from the This is highly possible due to a higher localization of electrons. In contrast, the Fe 3d orbitals on both Fe1 and Fe2 contribute to the conduction-band minimum in the cubic model. A higher localization of Fe 3d electrons in the tetragonal structure of LFO is associated with its U parameters being slightly larger than those in the cubic model (Table 1).
The PDOS profiles of Fe 3d on tetrahedral and octahedral sites are compared in Fig. 8, where the tetragonal model reveals a redistribution and extension of the unoccupied spin-up states, rather than a simple energy shift. Moreover, the PDOS profile of Fe 3d states on Fe2 exhibits a noticeably broader energy distribution in the tetragonal model compared with that in the cubic one. This suggests an increase in the bandwidth due to the electronic delocalization enhanced on the tetrahedral site Fe2 [Fig. 8(a)]. This contradicts the U values for a higher localization of Fe 3d electrons in the tetragonal model, as mentioned above. This conflict could be explained by p–d effects competing with on-site Coulomb interactions. The stability of LFO in the tetragonal structure might be enhanced by towards strong covalent interactions between Fe 3d electrons on Fe2 and O 2p electrons in the spin-up ferrimagnetic state.
![[Figure 8]](po5178fig8thm.gif) | Figure 8 PDOS of the cubic model (red lines) against the E − EF scale at the bottom, compared with PDOS of the tetragonal model (black lines) against the E − EF scale at the top: (a) Fe 3d spin-up electrons on tetrahedral sites and (b) Fe 3d spin-down electrons on octahedral sites. |
4.3. Magnetic properties
The calculated cubic and tetragonal LFO models commonly show a total magnetization value of 2.5 μB per formula unit, consistent with experimentally determined values (Boyraz et al., 2011; Kumawat et al., 2021; Liu et al., 2019). The calculated magnetic moments of Fe3+ on the octahedral site Fe1 are larger than those on the tetrahedral site Fe2 in the cubic model (Table 3). Similarly, the magnetic moments of Fe3+ on Fe1a (4.156 μB) and Fe1b (4.149 μB) are larger than that of the tetrahedral site Fe2 (4.044 μB), corresponding to the high-spin state expected for LFO.
| |||||||||||||||||||||||
We calculated the long-range magnetic interactions in LFO, resulting in negligibly small values near zero up to the fifth order. Hence, in this study, only the nearest magnetic interactions were considered. As shown in Fig. 9, there are four different nearest magnetic exchange interactions, i.e. the face-diagonal interaction JAB between Fe (A sublattice) and Fe (B sublattice), the space-diagonal term J′AB, and JBB and J′BB which are the corresponding face- and space-diagonal terms within the B Their magnitude ratios affect the degree and fashion of tetragonality in spinels (Menyuk et al., 1962). Therefore, to clarify the origin of the tetragonal lattice distortion a/c > 1 feasible in the ground state of LFO (Table 1), these magnetic exchange interaction parameters were calculated using SSSP pseudopotentials plus PBEsol. The resulting magnetic exchange parameters are highly reliable, as the band structure calculated using Wannier functions matches well that using Bloch states (Fig. 10).
![[Figure 9]](po5178fig9thm.gif) | Figure 9 Nearest magnetic interaction paths of Fe–Fe within an interatomic distance of 3.4 Å in the calculated tetragonal model of LFO (see the main text). |
![[Figure 10]](po5178fig10thm.gif) | Figure 10 Electronic band structures calculated by Wannier functions (circles) for the tetragonal model of LFO compared with those in Bloch states (lines; see also Fig. 6). Spin-up and spin-down electrons are presented in red and blue, respectively. |
To construct the effective spin Hamiltonian, magnetic exchange interactions were first evaluated using the magnetic moments projected onto Fe alone. In this case, the resulting exchange parameters correspond to effective Fe–Fe interactions, where O is not treated as an independent magnetic degree of freedom; the magnetic interaction contribution of O, arising from Fe–O–Fe superexchange processes, is implicitly included in the effective Fe–Fe exchange parameters. The total Hamiltonian (Htotal) is expressed by the static Hamiltonian Hstatic with the effective interaction Jeff,

where P is the spin exchange operator. This formalism allows us to derive a minimal Heisenberg model for the Fe sublattices. In another case, to prove the particularly in Fe2O4 as mentioned in Section 4.2, the magnetic moments were projected onto both Fe and O, with the spin polarization of ligand oxygens explicitly taken into account. As a result, a part of the magnetic coupling, which was incorporated into the effective Fe–Fe interaction in the previous case, is redistributed into Fe–O–Fe superexchange terms. The contribution of Fe–O–Fe superexchange interactions to Jeff corresponds to p–d The magnetic moments for both projection cases are listed in Table 4, along with the four nearest magnetic interactions calculated using Wannier functions. The magnitude differences on the octahedral sites Fe1a and Fe1b between the two projection cases are similar to each other. In contrast, the on Fe2 projected onto Fe (−4.9928 μB) is much larger than that from the projection onto both Fe and O (−4.1476 μB). Furthermore, the latter is very similar to the magnetic moment magnitude on Fe2 calculated in Bloch states (−4.044 μB). This large discrepancy (Δ) of 0.8542 μB on Fe2 between the two projection cases points to strong Fe–O–Fe superexchange interactions in Fe2O4. The superexchange effect in Fe1aO6 and Fe1bO6 might be smaller, as indicated by the respective low Δ values of 0.0845 μB and 0.1689 μB.
| |||||||||||||||||||||||||||||||||||||||||


The suggested strong Fe–O–Fe superexchange interactions are consistent with the pronounced p–d observed in the PDOS of the Fe 3d and O 2p states (Fig. 7). The Goodenough–Kanamori–Anderson (GKA) rules (Anderson, 1959; Kanamori, 1957; Kanamori, 1959) state that the sign and strength of superexchange interactions are influenced by ∠(Fe–O–Fe) angles and the orbital occupancy. The superexchanges Fe1a(↑)–O(↑)–Fe1b(↑) and Fe1b(↑)–O(↑)–Fe1b(↑) occur over ∠(Fe–O–Fe) ≃ 90° (Table A.III). According to the GKA rules, the bonding geometry of ∠(Fe–O–Fe) ≃ 90° favours ferromagnetic interactions due to the orthogonality of the involved orbitals. In contrast, the Fe1b(↑)–O(↑)–Fe2(↓) and Fe1a(↑)–O(↑)–Fe2(↓) pathways exhibit ∠(Fe–O–Fe) ≫ 90°. This favours antiferromagnetic coupling due to maximal overlap of the half-filled Fe 3d orbitals with the O 2p orbitals. The inclusion of O 2p states accounts for the strong Fe 3d–O 2p–Fe 3d on Fe2O4, where superexchange interactions are significant.
When applying the Yafet–Kittel model for spinels, the magnetic energy for a tetragonal distortion can be characterized by three dimensionless parameters, which describe the relative exchange interaction strength and the magnetic anisotropy (Menyuk et al., 1962). These parameters are defined as



The spin vectors SB = 5/2 and SA = −5/2 correspond to the respective high-spin states of Fe3+ in the B and A sublattices. Using the calculated parameters (JBB = 5.3791 meV, J′BB = 5.1697 meV, JAB = −1.4478 meV and J′AB = −1.8574 meV), the magnitudes of u, v and w were calculated to determine the tetragonality of LFO as follows:



The parameter u > 1 characterizes the relative strength of ferromagnetic interactions in the B in comparison with the antiferromagnetic interactions between the A and B sublattices. The condition v > 1/2 indicates that ferromagnetic interactions within the B are stronger on the ab plane than those parallel to the c direction; w < 1/2 implies that antiferromagnetic interactions between the A and B sublattices along the c axis are stronger than those in the ab plane. These parameters explain how a total energy lowering is realized by the tetragonal distortion a > c in LFO, induced by decreasing ferromagnetic interactions and increasing antiferromagnetic interactions along c, simultaneously. This explains the feasibility of the tetragonal structure model for LFO with an a/c ratio slightly larger than 1 (Table 1). In summary, the tiny tetragonality of LFO has a magnetic origin from strong ferromagnetic interactions in the B competing with the anisotropy of antiferromagnetic interactions, including the Fe–O–Fe superexchange.
5. Conclusions
There has been a need to find the true structure of α-LiFe5O8 (denoted LFO) compatible with a collinear ferrimagnetic spin arrangement on the crystallographic c axis. Thus, the aim of this study was to determine the true ground-state symmetry of LFO to re-examine and re-interpret its structural and physical properties. In a comprehensive first-principles investigation on the atomic, electronic and magnetic structures of LFO, we have dealt with two structural models in the cubic P4332, which has been known to be true for LFO to date, and in its tetragonal subgroup P43212. Results from SSSP+PBEsol+U calculations suggest that the tetragonal lattice is more favourable than the ideal cubic one within the calculation accuracy.
Our magnetic structure simulations show that LFO inherits the ferrimagnetic structure in the tetragonal magnetic P432′, which is consistent with the refined model from our recent analysis with HRNPD (to be published). This ferrimagnetic structure model comprises a spin-down tetrahedral diamond lattice (A sublattice) and a spin-up octahedral hyper-Kagome lattice (B sublattice). The calculated nearest-neighbour effective magnetic exchange interactions indicate that ferromagnetic interactions dominate over antiferromagnetic interactions in this ferrimagnetic arrangement. The new and insightful findings in this relevant prototype for MF-PVs are highlighted as follows:
(i) there is a tiny tetragonal a/c > 1 with a = 8.3528 (2) Å and c = 8.3511 (1) Å;
(ii) this faint tetragonality has a magnetic origin;
(iii) the Fe–O–Fe magnetic is consistent with Fe 3d–O 2p particularly strong in Fe2O4 tetrahedra;
(iv) the direct band gap of 2.050 eV for microstructure-free LFO in the tetragonal model is smaller than that in the cubic model.
As a relevant aspect, the extremely small tetragonality of LFO (and its variants) might be considered for developing LFO-based MF-PVs. Slight shifts in atomic positions caused by magnetic interactions in (multi)ferroic structures could be verified with greater accuracy at sub-picometre resolution using new resonant X-ray diffraction techniques (Richter et al., 2018), e.g. YMn2O5 (Weigel et al., 2024). On the other hand, to realize LFO-type PVs in industrial applications, further experimental and theoretical work is necessary to determine their dynamic magnetic charges (Ye & Vanderbilt, 2014) and the shift-current response under external fields (Jalaja & Dutta, 2015; Gong et al., 2024; Burger et al., 2019).
Last but not least, the present study could serve as a basis for enhancing PV effectiveness for LFO-type MFs. For instance, Al-doped LFO solid-solution compounds that exhibit a relatively strong tetragonal distortion (Inckemann et al., 2025) show significantly lower band-gap energies. Details will be reported elsewhere.
Supporting information
Supplementary File. DOI: https://doi.org/10.1107/S1600576726006709/po5178sup1.pdf
Acknowledgements
The authors acknowledge the Leibniz Supercomputing Center at Garching near Munich, Germany. Open access funding enabled and organized by Projekt DEAL.
Funding information
Yaoshi Cheng thanks the China Scholarship Council for financial support under grant No. 202204890001.
References
 Anderson, P. W. (1959). Phys. Rev. 115, 2–13. CrossRef Google Scholar
Anisimov, V. I., Zaanen, J. & Andersen, O. K. (1991). Phys. Rev. B 44, 943–954. CrossRef Google Scholar
Astafyev, A., Lysenko, E. & Surzhikov, A. (2019). J. Therm. Anal. Calorim. 136, 441–445. CrossRef Google Scholar
Babrekar, M. & Jadhav, K. (2017). Int. Res. J. Sci. Eng. Spec. 1, 73–76. Google Scholar
Bagayoko, D. (2014). AIP Adv. 4, 127104. Google Scholar
Baroni, S., de Gironcoli, S., Dal Corso, A. & Giannozzi, P. (2001). Rev. Mod. Phys. 73, 515–562. Web of Science CrossRef CAS Google Scholar
Birch, F. (1947). Phys. Rev. 71, 809–824. CrossRef CAS Web of Science Google Scholar
Boyraz, C., Mazumdar, D., Iliev, M., Marinova, V., Ma, J., Srinivasan, G. & Gupta, A. (2011). Appl. Phys. Lett. 98, 012507. CrossRef Google Scholar
Burger, A. M., Agarwal, R., Aprelev, A., Schruba, E., Gutierrez-Perez, A., Fridkin, V. M. & Spanier, J. E. (2019). Sci. Adv. 5, eaau5588. CrossRef Google Scholar
Chireh, M. & Naseri, M. (2019). Adv. Powder Technol. 30, 952–960. CrossRef Google Scholar
de Picciotto, L. A. & Thackeray, M. M. (1986). Mater. Res. Bull. 21, 583–592. CrossRef Google Scholar
Dharmadhikari, V. S. & Grannemann, W. W. (1982). J. Appl. Phys. 53, 8988–8992. CrossRef Google Scholar
Dhass, A. D., Kumar, R. S., Lakshmi, P., Natarajan, E. & Arivarasan, A. (2020). Mater. Today Proc. 22, 330–334. CrossRef Google Scholar
Ederer, C. & Spaldin, N. A. (2006). Phys. Rev. B 74, 024102. CrossRef Google Scholar
Giannozzi, P., Andreussi, O., Brumme, T., Bunau, O., Buongiorno Nardelli, M., Calandra, M., Car, R., Cavazzoni, C., Ceresoli, D., Cococcioni, M., Colonna, N., Carnimeo, I., Dal Corso, A., de Gironcoli, S., Delugas, P., DiStasio, R. A., Ferretti, A., Floris, A., Fratesi, G., Fugallo, G., Gebauer, R., Gerstmann, U., Giustino, F., Gorni, T., Jia, J., Kawamura, M., Ko, H. Y., Kokalj, A., Küçükbenli, E., Lazzeri, M., Marsili, M., Marzari, N., Mauri, F., Nguyen, N. L., Nguyen, H. V., Otero-de-la-Roza, A., Paulatto, L., Poncé, S., Rocca, D., Sabatini, R., Santra, B., Schlipf, M., Seitsonen, A. P., Smogunov, A., Timrov, I., Thonhauser, T., Umari, P., Vast, N., Wu, X. & Baroni, S. (2017). J. Phys. Condens. Matter 29, 465901. CrossRef Google Scholar
Giannozzi, P., Baroni, S., Bonini, N., Calandra, M., Car, R., Cavazzoni, C., Ceresoli, D., Chiarotti, G. L., Cococcioni, M., Dabo, I., Dal Corso, A., de Gironcoli, S., Fabris, S., Fratesi, G., Gebauer, R., Gerstmann, U., Gougoussis, C., Kokalj, A., Lazzeri, M., Martin-Samos, L., Marzari, N., Mauri, F., Mazzarello, R., Paolini, S., Pasquarello, A., Paulatto, L., Sbraccia, C., Scandolo, S., Sclauzero, G., Seitsonen, A. P., Smogunov, A., Umari, P. & Wentzcovitch, R. M. (2009). J. Phys. Condens. Matter 21, 395502. Web of Science CrossRef PubMed Google Scholar
Gong, Z., Xun, Y., Qian, Z., Chang, K., Qi, J. & Wang, H. (2024). Phys. Rev. B 110, 094408. CrossRef Google Scholar
Gridnev, V. N., Krichevtsov, B. B., Pavlov, V. V. & Pisarev, R. V. (1997). JETP Lett. 65, 68–73. CrossRef Google Scholar
He, X., Helbig, N., Verstraete, M. J. & Bousquet, E. (2021). Comput. Phys. Commun. 264, 107938. CrossRef Google Scholar
Huang, X., Lan, N., Chen, W., Yan, Y., Zeng, W. & Liu, S. (2021). J. Mater. Sci. 56, 8334–8357. CrossRef Google Scholar
Iliev, M. N., Ivanov, V. G., Todorov, N. D., Marinova, V., Abrashev, M. V., Petrova, R., Wang, Y.-Q. & Litvinchuk, A. P. (2011). Phys. Rev. B 83, 174111. CrossRef Google Scholar
Inckemann, S., Park, S.-H., Arauzo, A. & Avdeev, M. (2025). J. Solid State Chem. 347, 125325. CrossRef Google Scholar
Jalaja, M. A. & Dutta, S. (2015). Adv. Mater. Lett. 6, 568–584. Google Scholar
Ji, W., Yao, K. & Liang, Y. C. (2010). Adv. Mater. 22, 1763–1766. CrossRef Google Scholar
Kanamori, J. (1957). Prog. Theor. Phys. 17, 197–222. CrossRef Google Scholar
Kanamori, J. (1959). J. Phys. Chem. Solids 10, 87–98. CrossRef CAS Google Scholar
Kim, S.-Y., Kim, K.-S., Jong, U.-G., Kang, C.-J., Ri, S.-C. & Yu, C.-J. (2022). RSC Adv. 12, 15973–15979. CrossRef Google Scholar
Kinoshita, Y., Kida, N., Sotome, M., Miyamoto, T., Iguchi, Y., Onose, Y. & Okamoto, H. (2016). ACS Photonics 3, 1170–1175. CrossRef Google Scholar
Koch, W. T. H., Munser, R., Ruppel, W. & Würfel, P. (1975). Solid State Commun. 17, 847–850. CrossRef Google Scholar
Kumawat, K. K., Jain, A., Meena, S. S. & Yusuf, S. M. (2021). J. Alloys Compd. 865, 158849. CrossRef Google Scholar
Lee, E. & Son, J. Y. (2024). ACS Mater. Lett. 6, 4248–4254. CrossRef Google Scholar
Li, H., Wang, X., Zhou, P., Wu, H., Zhong, C., Dong, Z. & Liu, J. (2020). J. Alloys Compd. 821, 153199. CrossRef Google Scholar
Liechtenstein, A. I., Katsnelson, M. I., Antropov, V. P. & Gubanov, V. A. (1987). J. Magn. Magn. Mater. 67, 65–74. CrossRef CAS Google Scholar
Liu, R., Pan, L., Peng, S., Qin, L., Bi, J., Wu, J., Wu, H. & Ye, Z.-G. (2019). J. Mater. Chem. C 7, 1999–2004. CrossRef Google Scholar
Mahapatra, M., Pati, D. K., Sahu, B., Sahoo, P. K., Parida, R. K., Parida, B. N. & Padhee, R. (2024). J. Mater. Sci. Mater. Electron. 35, 582. CrossRef Google Scholar
Massoudi, J., Bouekkeze, D., Bougoffa, A., Khirouni, K., Dhahri, E. & Bessais, L. (2020). Adv. Powder Technol. 31, 4714–4730. CrossRef Google Scholar
Menyuk, N., Dwight, K., Lyons, D. & Kaplan, T. A. (1962). Phys. Rev. 127, 1983–1996. CrossRef Google Scholar
Mercier, M., Velleaud, G. & Puvinel, J. (1977). Phys. B+C 86–88, 1089–1090. CrossRef Google Scholar
Mohapatra, P. P. & Dobbidi, P. (2023). Appl. Surf. Sci. 619, 156706. CrossRef Google Scholar
Moore, G. C., Horton, M. K., Linscott, E., Ganose, A. M., Siron, M., O'Regan, D. D. & Persson, K. A. (2024). Phys. Rev. Mater. 8, 014409. CrossRef Google Scholar
Nakamura, M., Chan, Y.-H., Yasunami, T., Huang, Y.-S., Guo, G.-Y., Hu, Y., Ogawa, N., Chiew, Y., Yu, X., Morimoto, T., Nagaosa, N., Tokura, Y. & Kawasaki, M. (2024). Nat. Commun. 15, 9672. CrossRef Google Scholar
Neaton, J. B., Ederer, C., Waghmare, U. V., Spaldin, N. A. & Rabe, K. M. (2005). Phys. Rev. B 71, 014113. CrossRef Google Scholar
Nechache, R., Harnagea, C., Li, S., Cardenas, L., Huang, W., Chakrabartty, J. & Rosei, F. (2015). Nat. Photonics 9, 61–67. CrossRef Google Scholar
Pachauri, N., Khodadadi, B., Althammer, M., Singh, A. V., Loukya, B., Datta, R., Iliev, M., Bezmaternykh, L., Gudim, I., Mewes, T. & Gupta, A. (2015). J. Appl. Phys. 117, 233907. Google Scholar
Peng, Y.-T., Chiou, S.-H., Hsiao, C.-H., Hao Ouyang, C. & Tu, C.-S. (2017). Sci. Rep. 7, 45164. CrossRef Google Scholar
Perdew, J. P., Burke, K. & Ernzerhof, M. (1996). Phys. Rev. Lett. 77, 3865–3868. CrossRef PubMed CAS Web of Science Google Scholar
Perdew, J. P., Ruzsinszky, A., Csonka, G. I., Vydrov, O. A., Scuseria, G. E., Constantin, L. A., Zhou, X. & Burke, K. (2008). Phys. Rev. Lett. 100, 136406. Web of Science CrossRef PubMed Google Scholar
Pizzi, G., Vitale, V., Arita, R., Blügel, S., Freimuth, F., Géranton, G., Gibertini, M., Gresch, D., Johnson, C., Koretsune, T., Ibañez-Azpiroz, J., Lee, H., Lihm, J. M., Marchand, D., Marrazzo, A., Mokrousov, Y., Mustafa, J. I., Nohara, Y., Nomura, Y., Paulatto, L., Poncé, S., Ponweiser, T., Qiao, J., Thöle, F., Tsirkin, S. S., Wierzbowska, M., Marzari, N., Vanderbilt, D., Souza, I., Mostofi, A. A. & Yates, J. R. (2020). J. Phys. Condens. Matter 32, 165902. CrossRef Google Scholar
Prandini, G., Marrazzo, A., Castelli, I. E., Mounet, N. & Marzari, N. (2018). npj Comput. Mater. 4, 72. CrossRef Google Scholar
Rangel, T., Fregoso, B. M., Mendoza, B. S., Morimoto, T., Moore, J. E. & Neaton, J. B. (2017). Phys. Rev. Lett. 119, 067402. CrossRef Google Scholar
Richter, C., Zschornak, M., Novikov, D., Mehner, E., Nentwich, M., Hanzig, J., Gorfman, S. & Meyer, D. C. (2018). Nat. Commun. 9, 178. Web of Science CrossRef PubMed Google Scholar
Song, Z., Li, Z., Zhang, J., Chen, Z., Suescun, L. & Liu, Q. (2023). J. Appl. Cryst. 56, 884–888. CrossRef IUCr Journals Google Scholar
Song, Z. & Liu, Q. (2019). Phys. Chem. Chem. Phys. 21, 2372–2377. CrossRef Google Scholar
Soreto, S., Graça, M., Valente, M. & Costa, L. (2017). Magnetic Spinels – Synthesis, Properties and Applications, pp. 31–50. InTech. Google Scholar
Sousa, O. M., Araujo, R. S. & Freitas, S. M. (2019). Comput. Theor. Chem. 1159, 27–30. CrossRef Google Scholar
Tan, S., Zhang, W., Jiao, F., Zhou, Y., Yang, L., Shi, W. & Wang, Z. (2021). Cryst. Res. Technol. 56, 2100076. CrossRef Google Scholar
Teixeira, S. S., Graça, M. P. F., Lucas, J., Valente, M. A., Soares, P. I. P., Lança, M. C., Vieira, T., Silva, J. C., Borges, J. P., Jinga, L.-I., Socol, G., Mello Salgueiro, C., Nunes, J. & Costa, L. C. (2021). Nanomaterials 11, 193. CrossRef Google Scholar
Timrov, I., Marzari, N. & Cococcioni, M. (2022). Comput. Phys. Commun. 279, 108455. CrossRef Google Scholar
von Baltz, R. & Kraut, W. (1981). Phys. Rev. B 23, 5590–5596. CrossRef Google Scholar
Vopson, M. M. (2015). Crit. Rev. Solid State Mater. Sci. 40, 223–250. CrossRef CAS Google Scholar
Weigel, T., Richter, C., Nentwich, M., Mehner, E., Garbe, V., Bouchenoire, L., Novikov, D., Meyer, D. C. & Zschornak, M. (2024). Phys. Rev. B 109, 054101. CrossRef Google Scholar
Xiao, R.-C., Jin, Y. J. & Jiang, H. (2023). APL Mater. 11, 070903. Google Scholar
Xu, H., Wang, H., Zhou, J. & Li, J. (2021). Nat. Commun. 12, 4330. CrossRef Google Scholar
Yang, S. Y., Martin, L. W., Byrnes, S. J., Conry, T. E., Basu, S. R., Paran, D., Reichertz, L., Ihlefeld, J., Adamo, C., Melville, A., Chu, Y., Yang, C., Musfeldt, J. L., Schlom, D. G., Ager, J. W. III & Ramesh, R. (2009). Appl. Phys. Lett. 95, 062909. Google Scholar
Ye, M. & Vanderbilt, D. (2014). Phys. Rev. B 89, 064301. CrossRef Google Scholar
Young, S. M., Zheng, F. & Rappe, A. M. (2013). Phys. Rev. Lett. 110, 057201. CrossRef Google Scholar
Zhang, D. & Zhang, L. (2016). New J. Chem. 40, 7171–7180. CrossRef Google Scholar
This is an open-access article distributed under the terms of the Creative Commons Attribution (CC-BY) Licence, which permits unrestricted use, distribution, and reproduction in any medium, provided the original authors and source are cited.
| JOURNAL OF APPLIED CRYSTALLOGRAPHY |
access


