

 menu
|
|
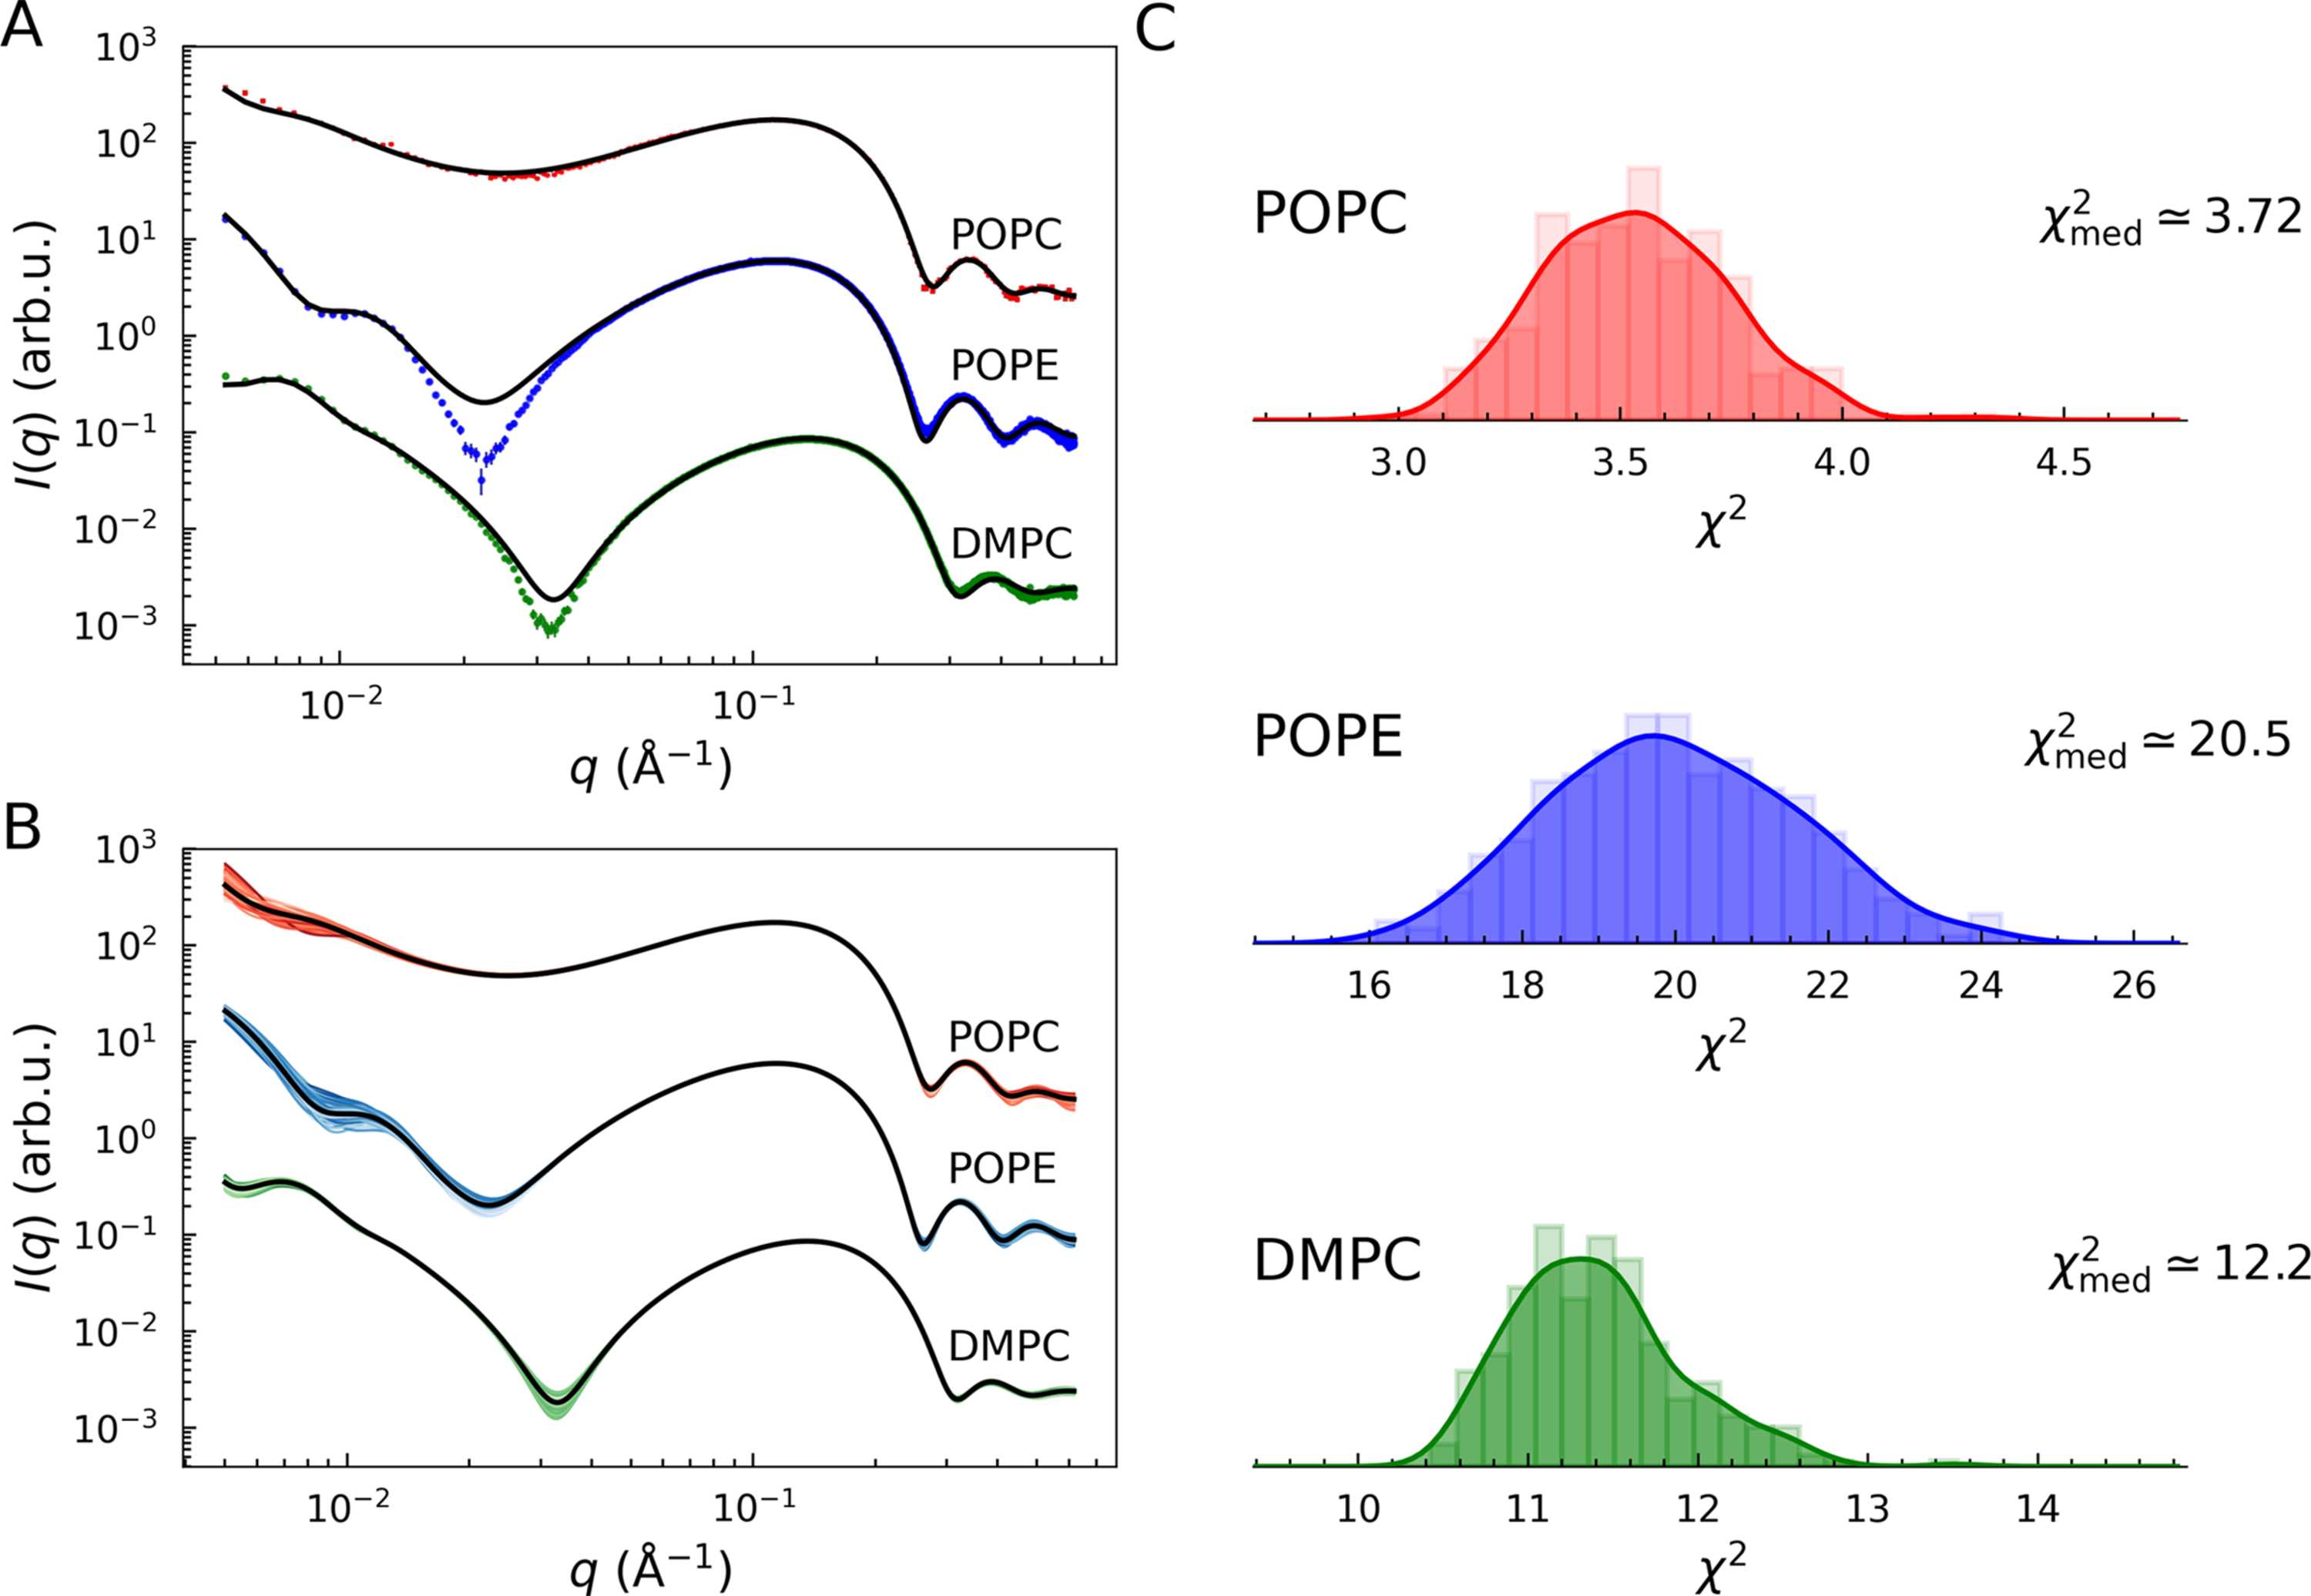
Figure 3
Best fits of POPC (red), POPE (blue) and DMPC (green) LUV SAXS data with  . (A) Black lines display the model as a function of the parameter medians. These are compared with the best fits of each iteration in (B), where the shade of color reflects the best  values (brighter for low values, darker for high values). (C) Distributions of  values.  values were calculated using the adjustable parameter medians. Smooth curves display the kernel density estimates (KDEs) of the underlying histograms. |
 | JOURNAL OF APPLIED CRYSTALLOGRAPHY |
ISSN: 1600-5767
 access