

 menu
|
|
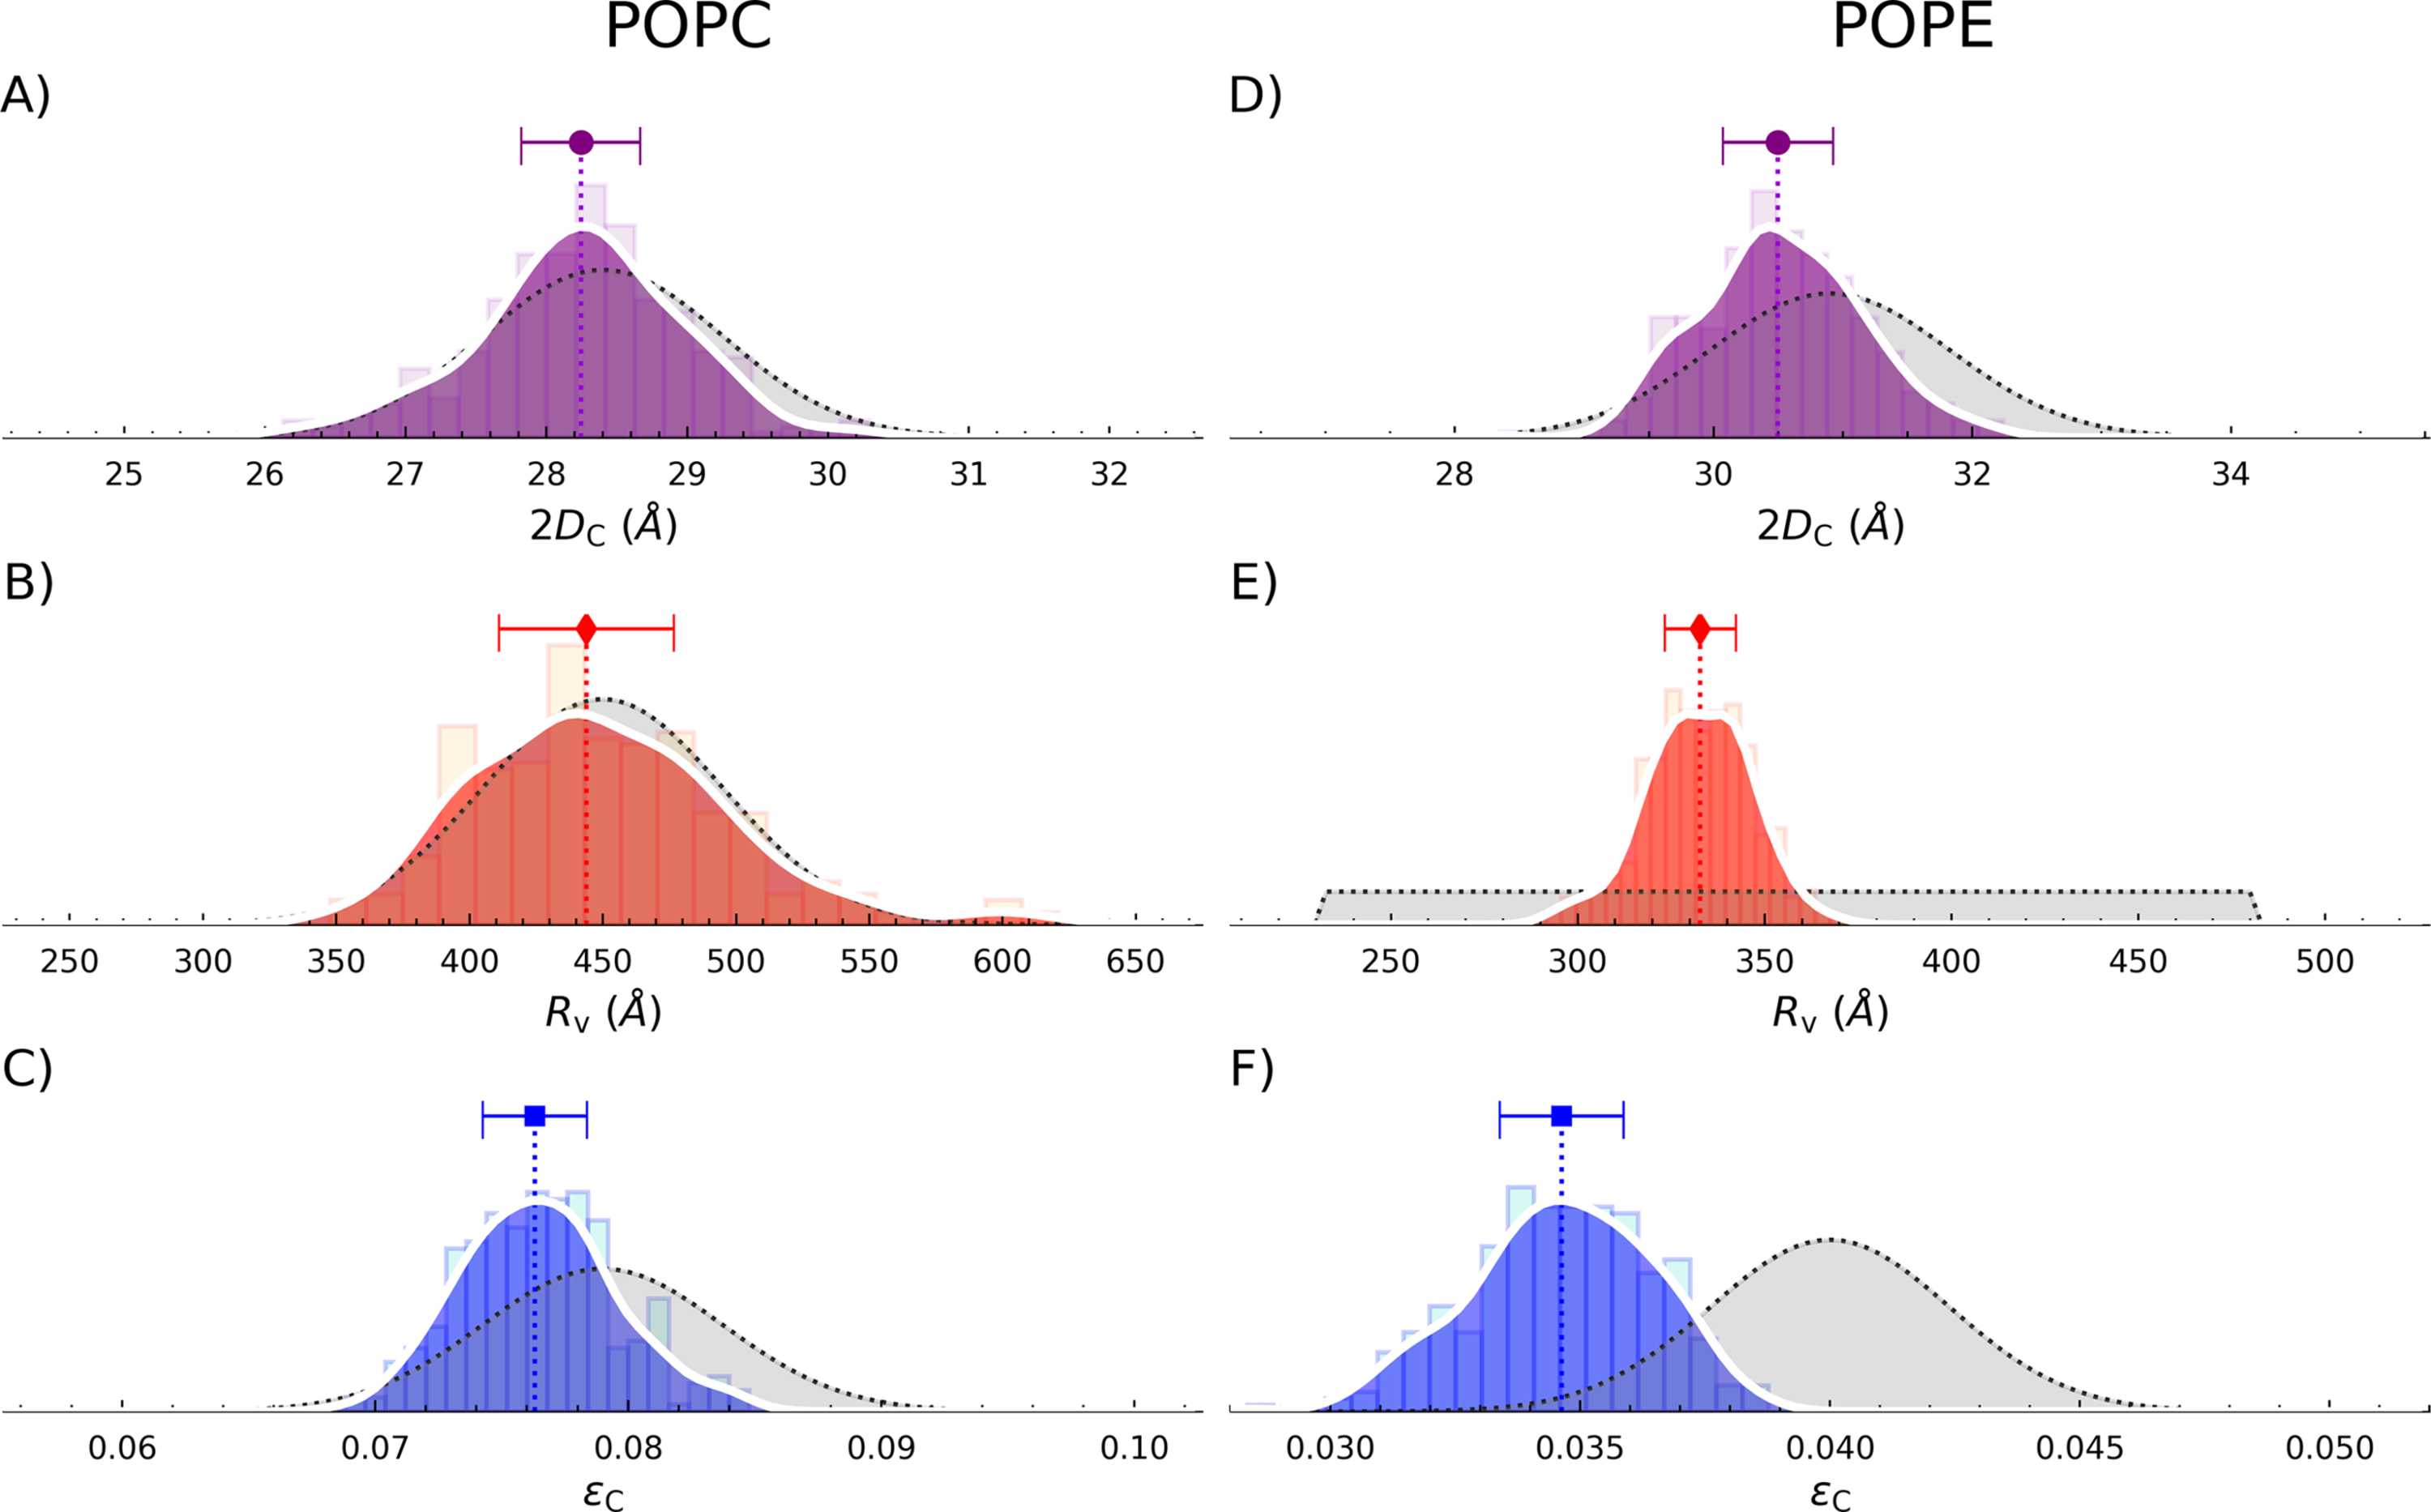
Figure 4
Comparison between probability density distributions (posteriors) and priors of three selected adjustable parameters obtained during the curve fitting of POPC (A–C) and POPE systems (D–F). (A, D) Acyl-chain thickness  ; (B, E) vesicle radius  ; and (C, F) relative variation of acyl-chain thickness  . The histograms contain  entries; colored curves represent KDEs, while dotted black lines show the associated prior distribution. Symbols with error bars highlight the median and MAD values for each probability distribution. |
 | JOURNAL OF APPLIED CRYSTALLOGRAPHY |
ISSN: 1600-5767
 access