

 menu
|
|
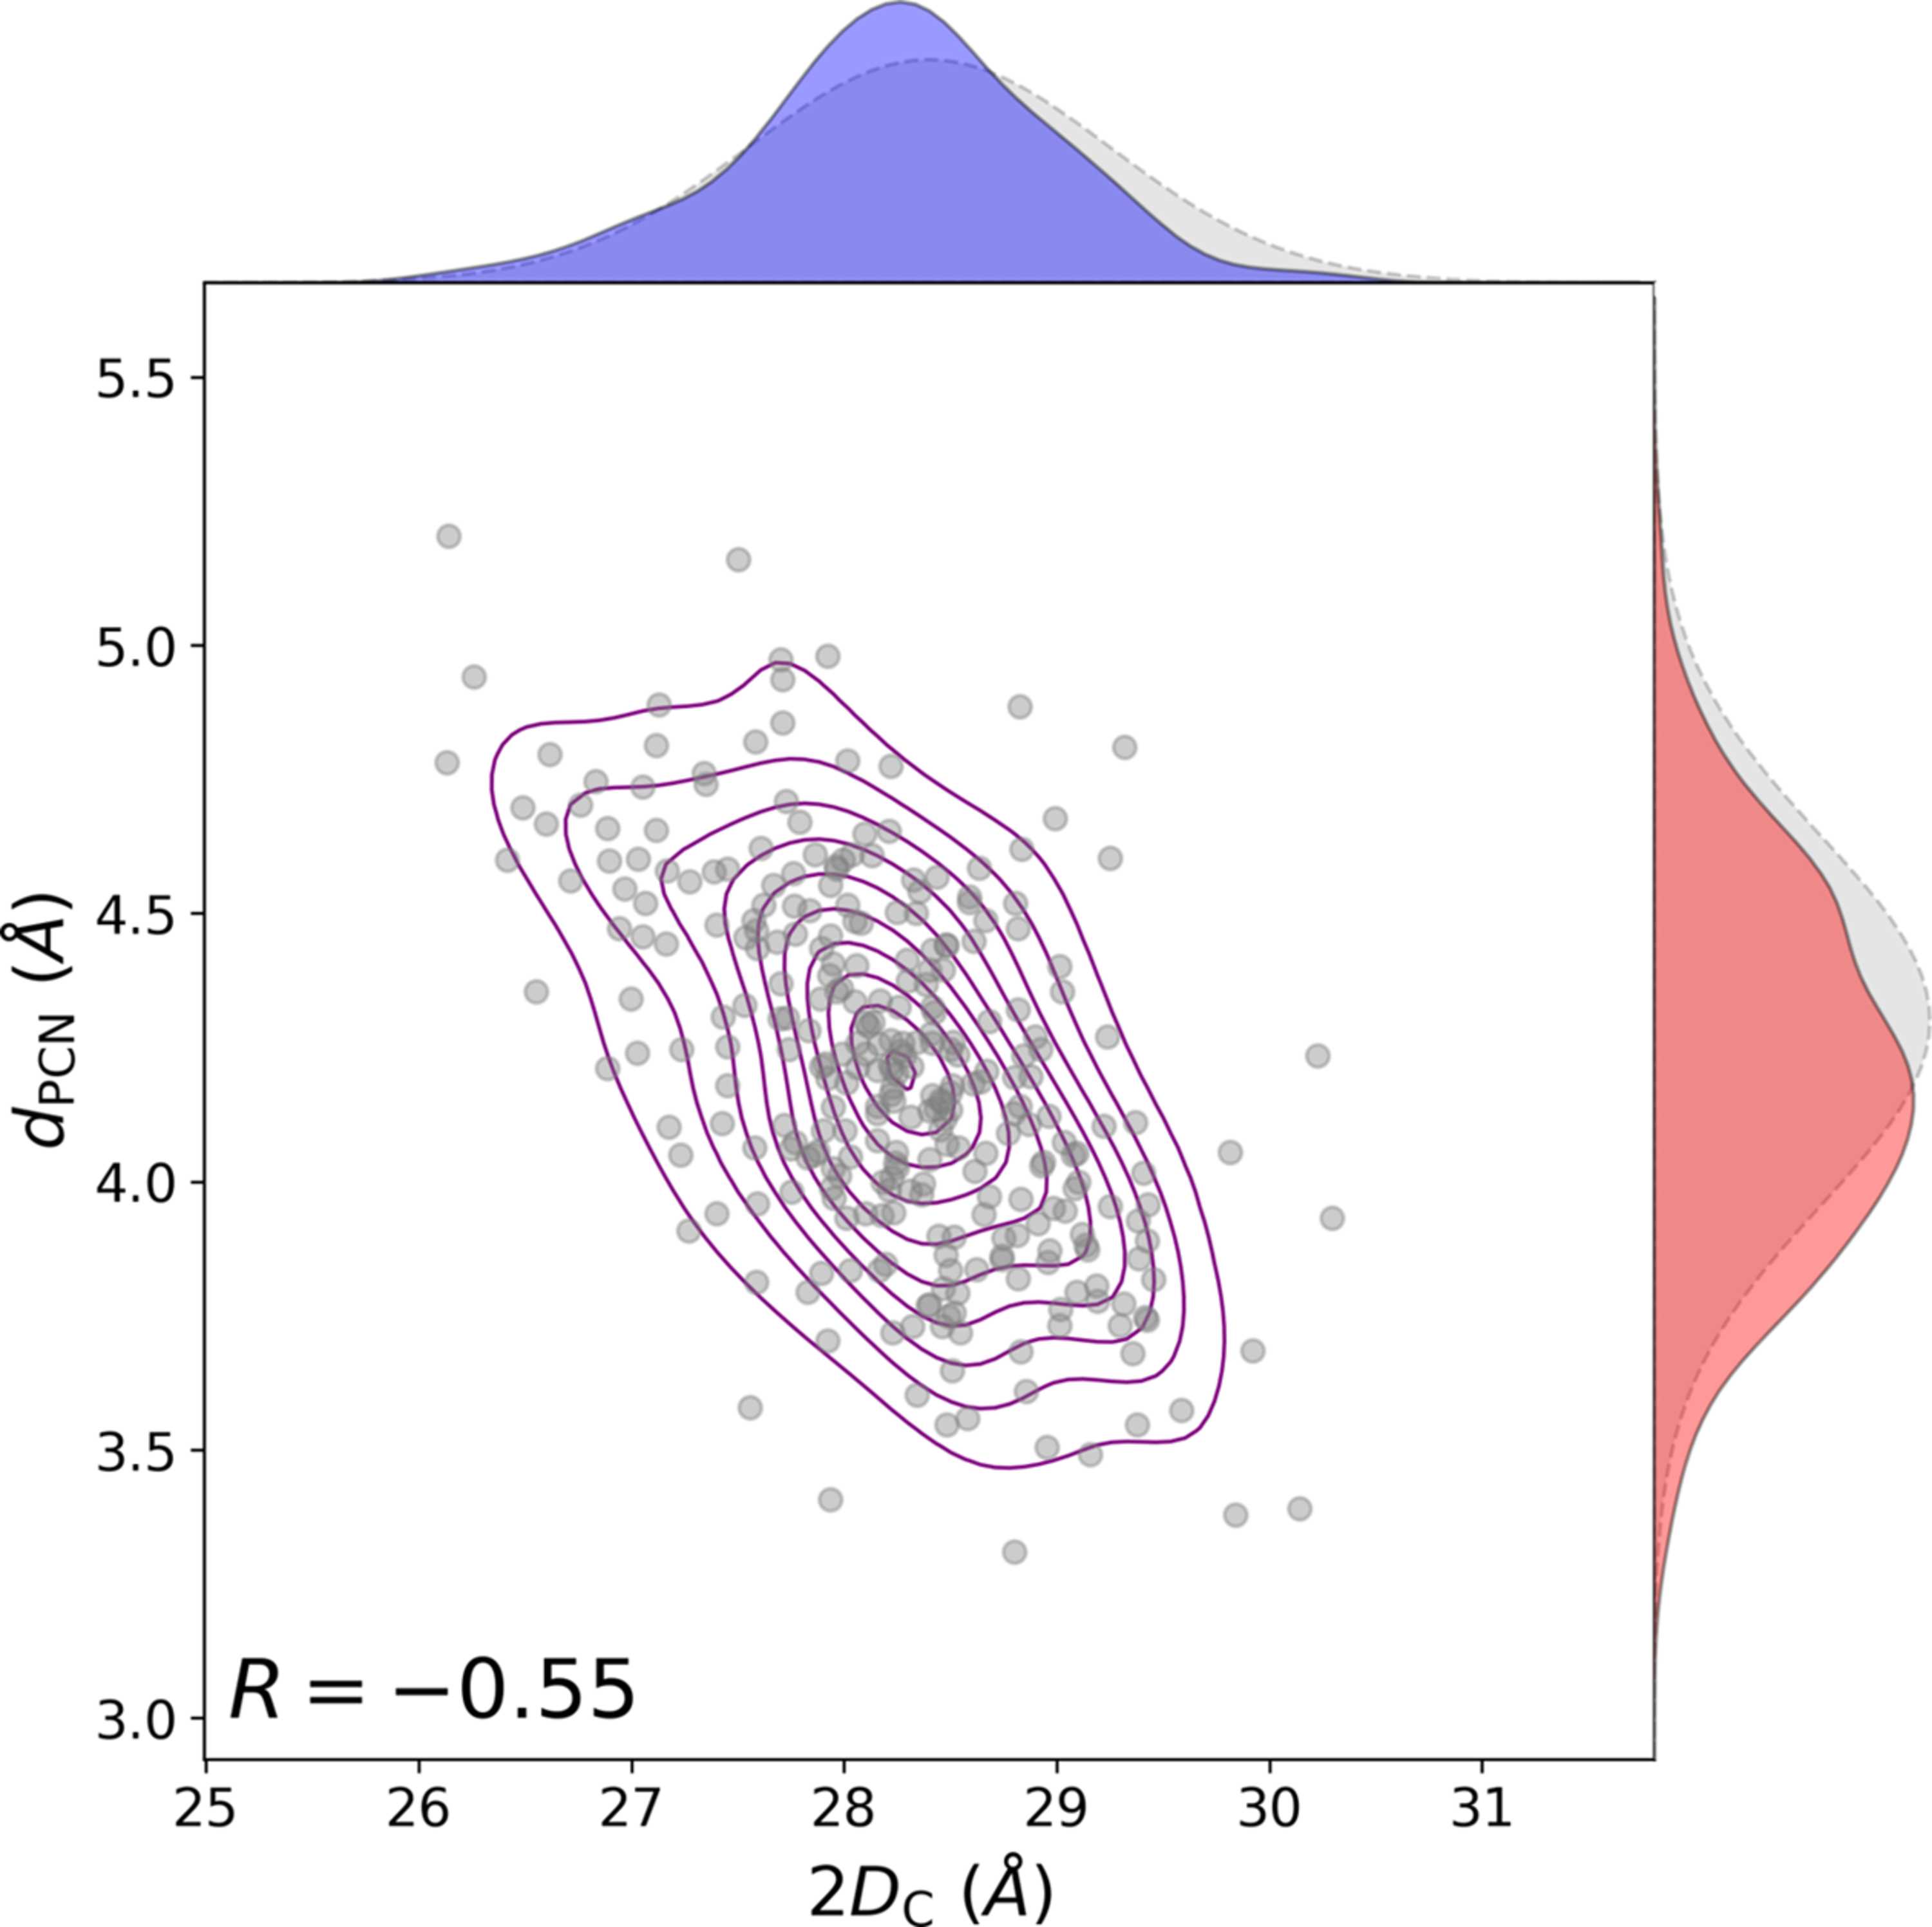
Figure 5
KDE bivariate density map and associated probability densities of two selected adjustable parameters obtained during the curve fitting of POPC systems: acyl-chain thickness  (blue, x axis) and distance between PCN and CG quasi-molecular groups  (red, y axis). Results from  iterations. Dashed gray lines indicate the associated prior distribution. R is the Pearson correlation coefficient. |
 | JOURNAL OF APPLIED CRYSTALLOGRAPHY |
ISSN: 1600-5767
 access