

 menu
|
|
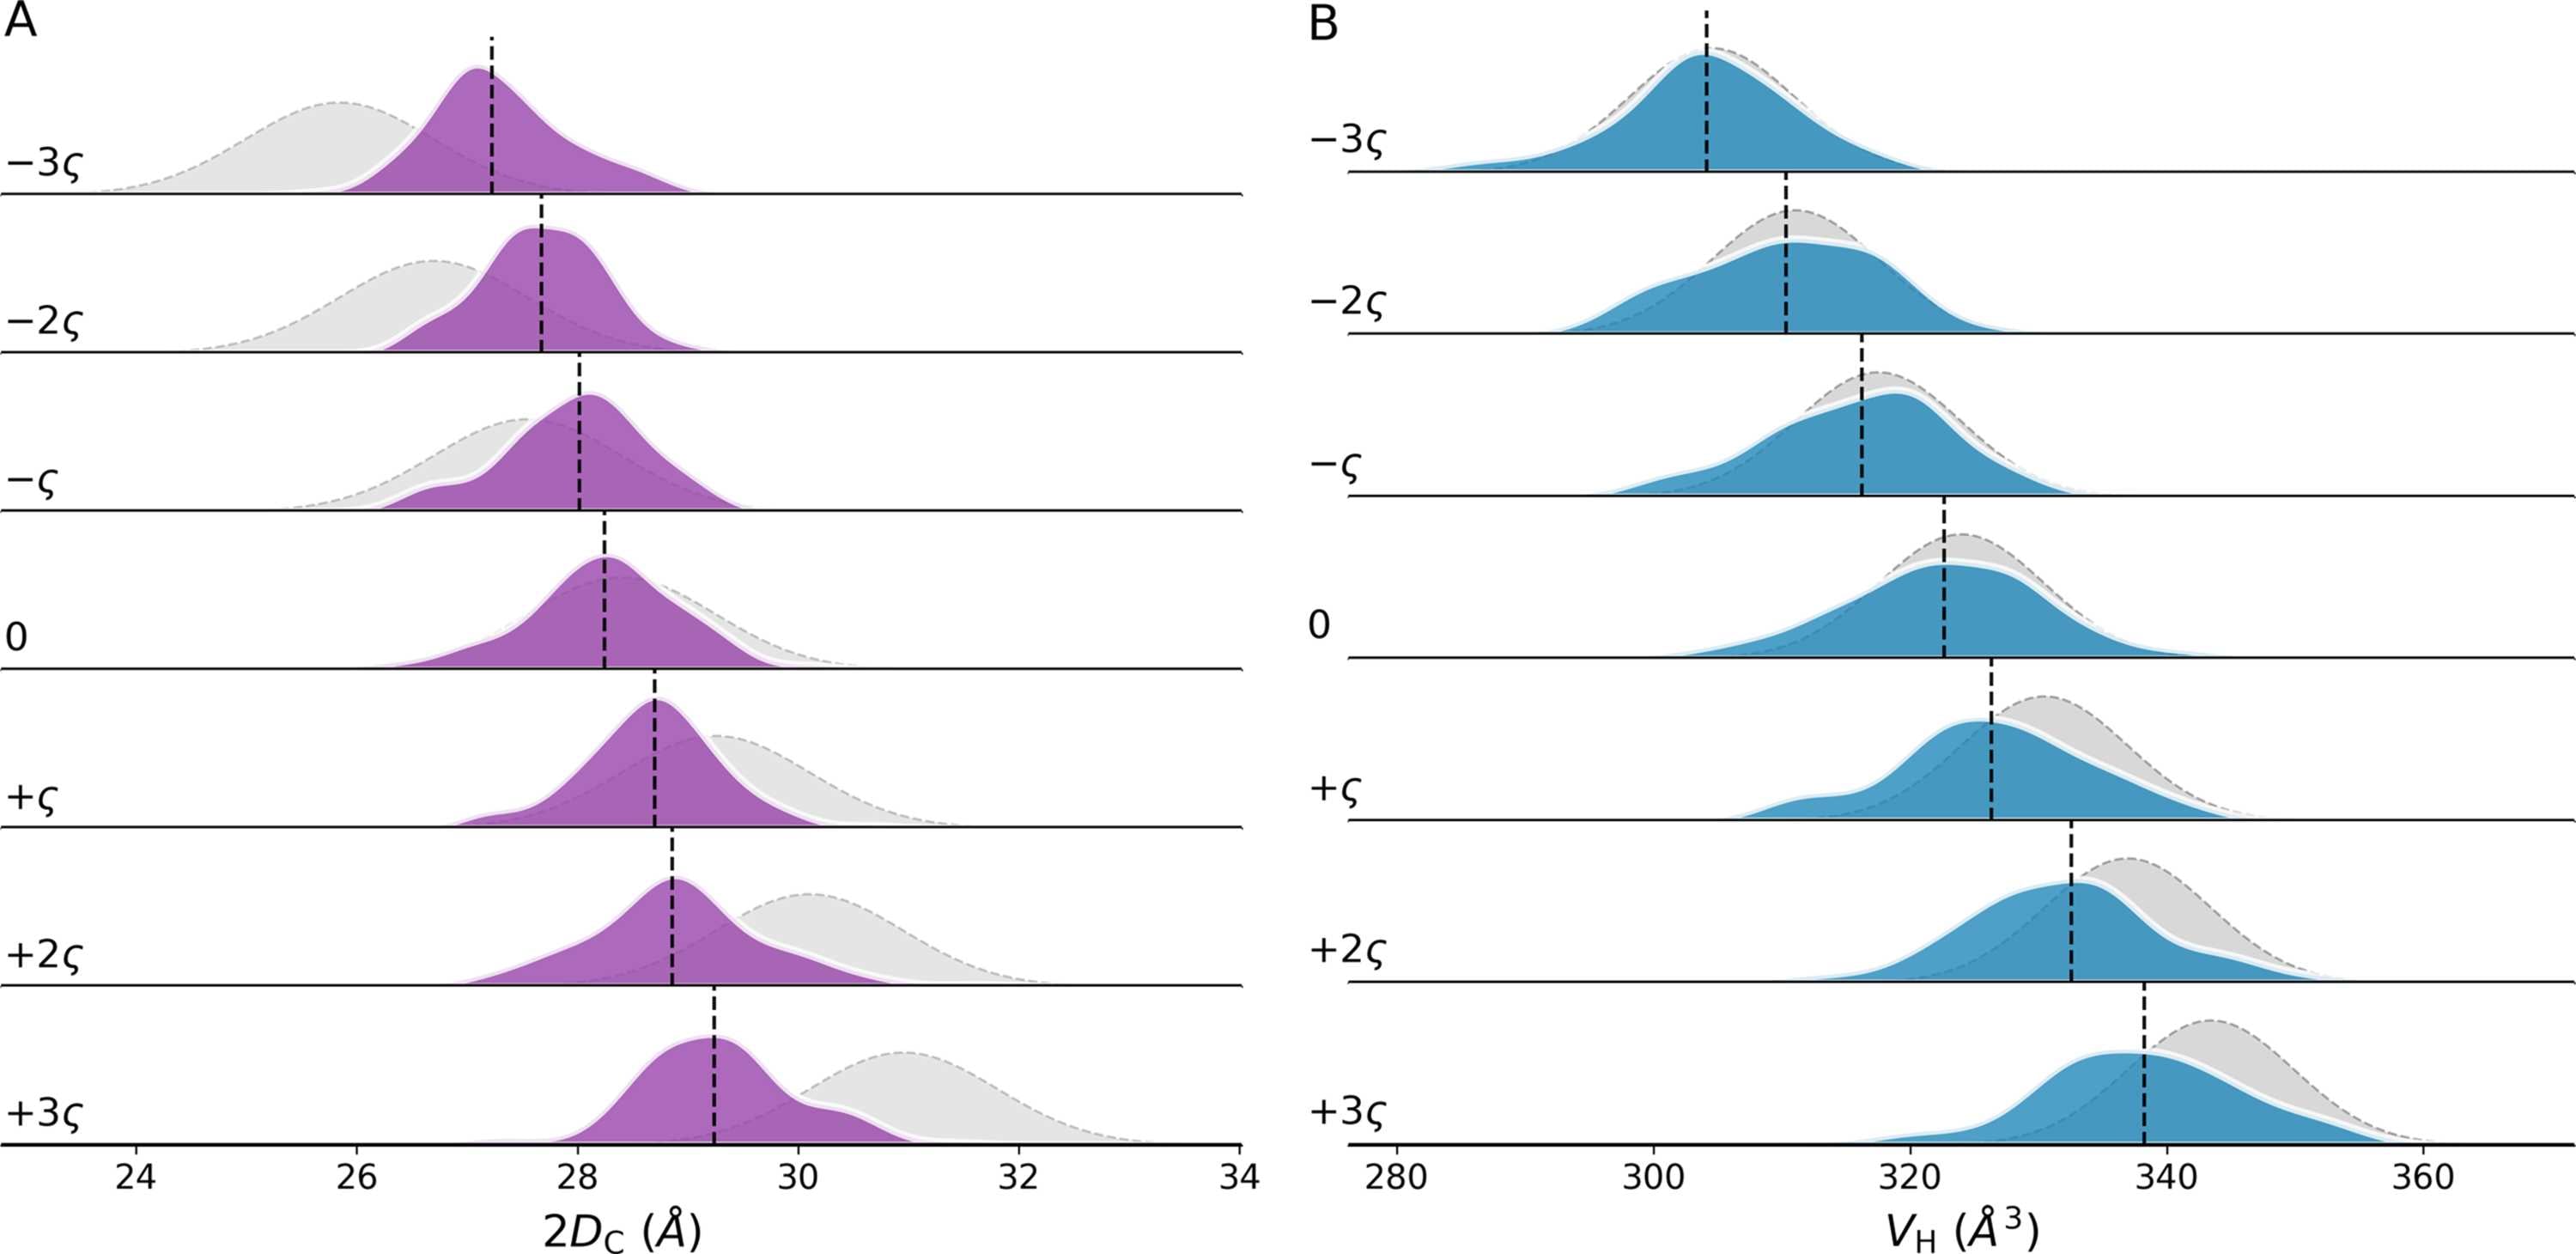
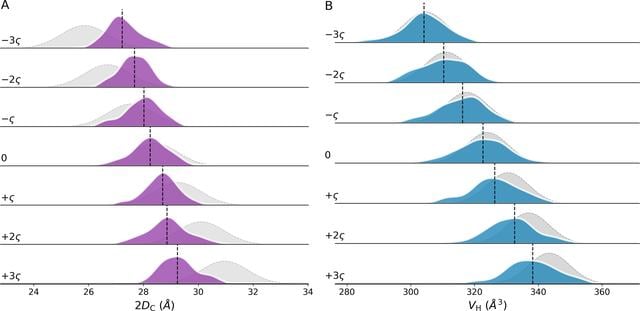
Figure 6
Verifying the dependency of parameter distributions on priors: sensitive versus non-sensitive parameters. (A) Acyl-chain thickness  distributions (KDE representation in purple) against priors shifted by  (gray). (B) Lipid head-group volume  distributions (KDE representation in blue) against priors shifted by (gray). Vertical dashed lines indicate the medians of the adjustable parameter distributions. Number of iterations for each independent analysis  . |
 | JOURNAL OF APPLIED CRYSTALLOGRAPHY |
ISSN: 1600-5767
 access