

 menu
|
|
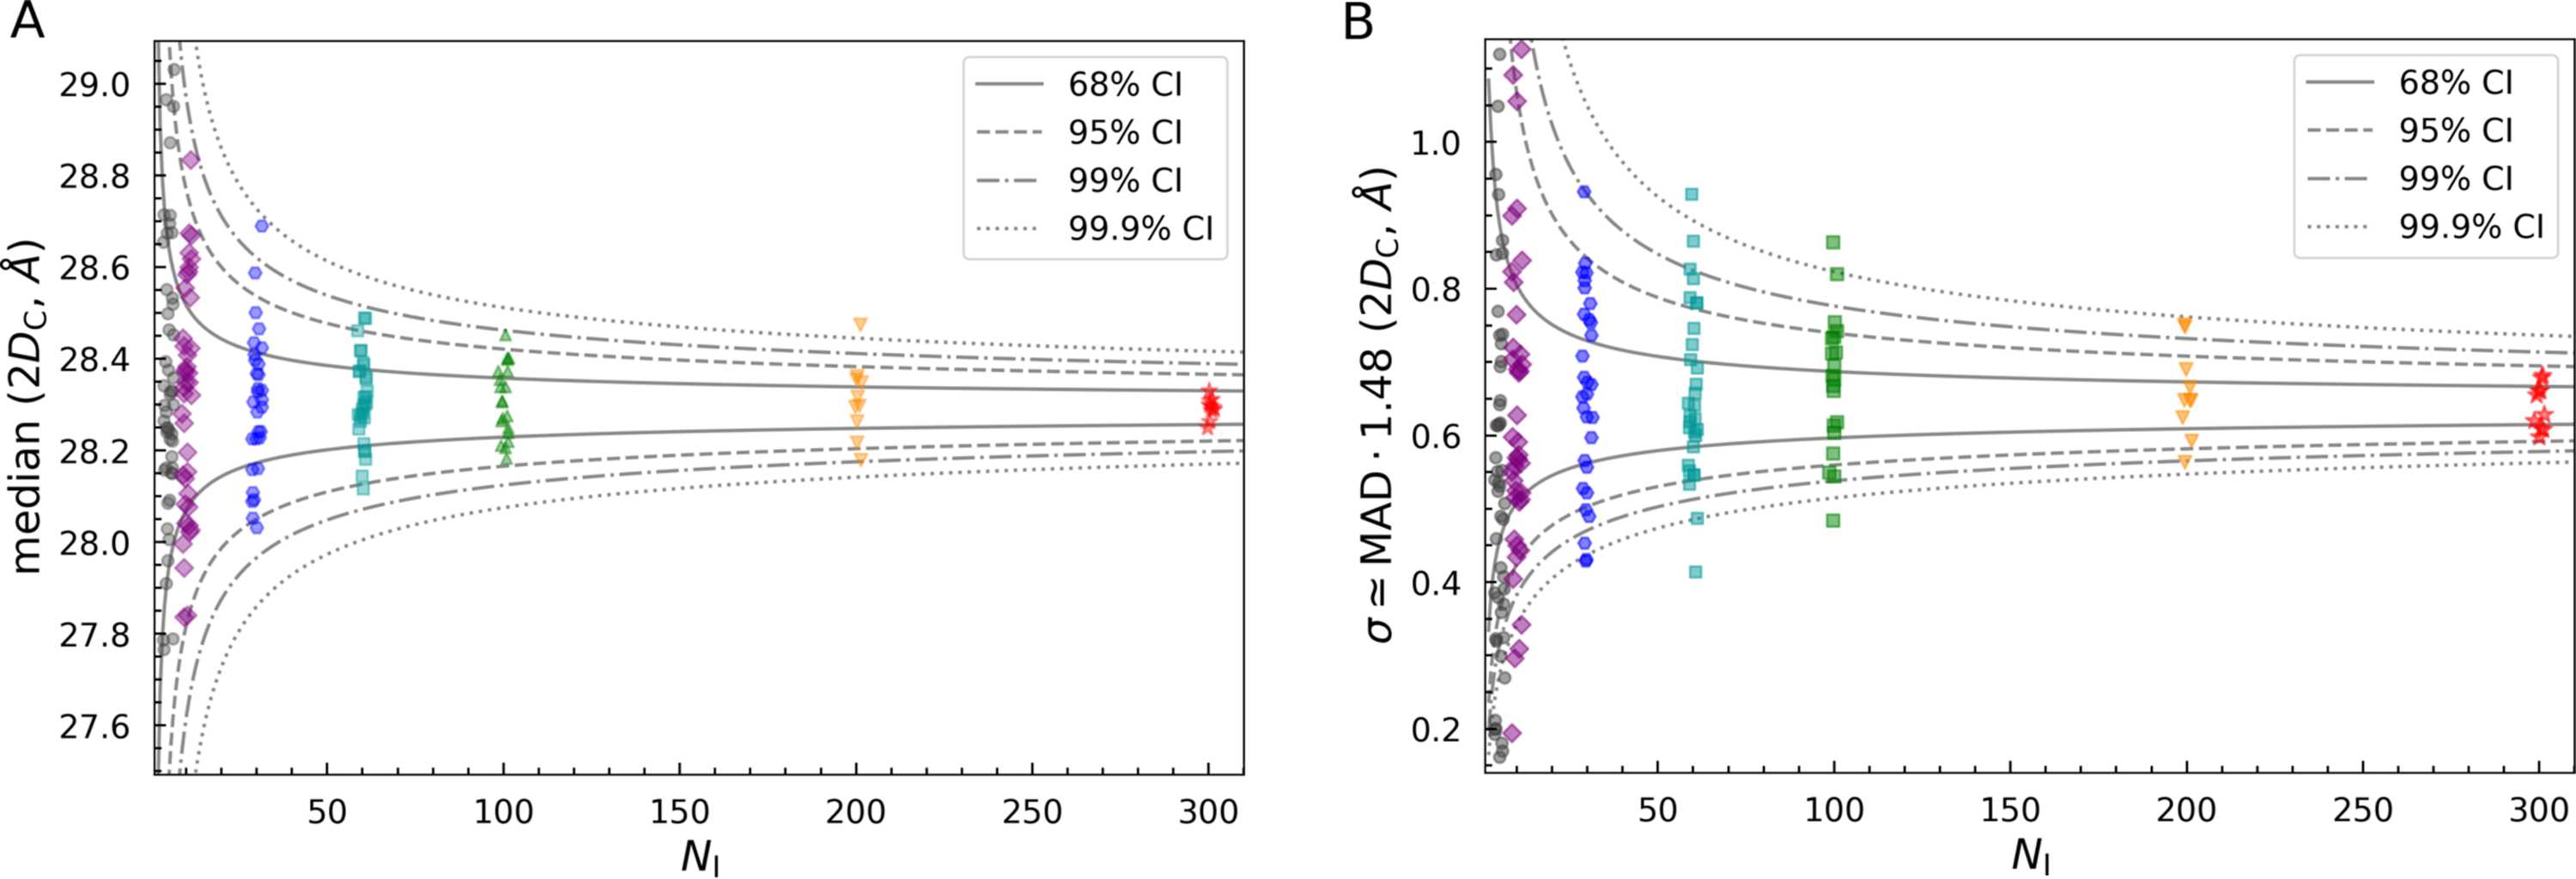
Figure 7
Median (A) and equivalent standard deviation (B)  values from independent analyses performed at different  values. Lines mark the ranges for different levels of CIs. These are calculated using equations (7) (A) and (8) (B), by using the average of the outcomes for  as  and  values. |
 | JOURNAL OF APPLIED CRYSTALLOGRAPHY |
ISSN: 1600-5767
 access