

 menu
|
|
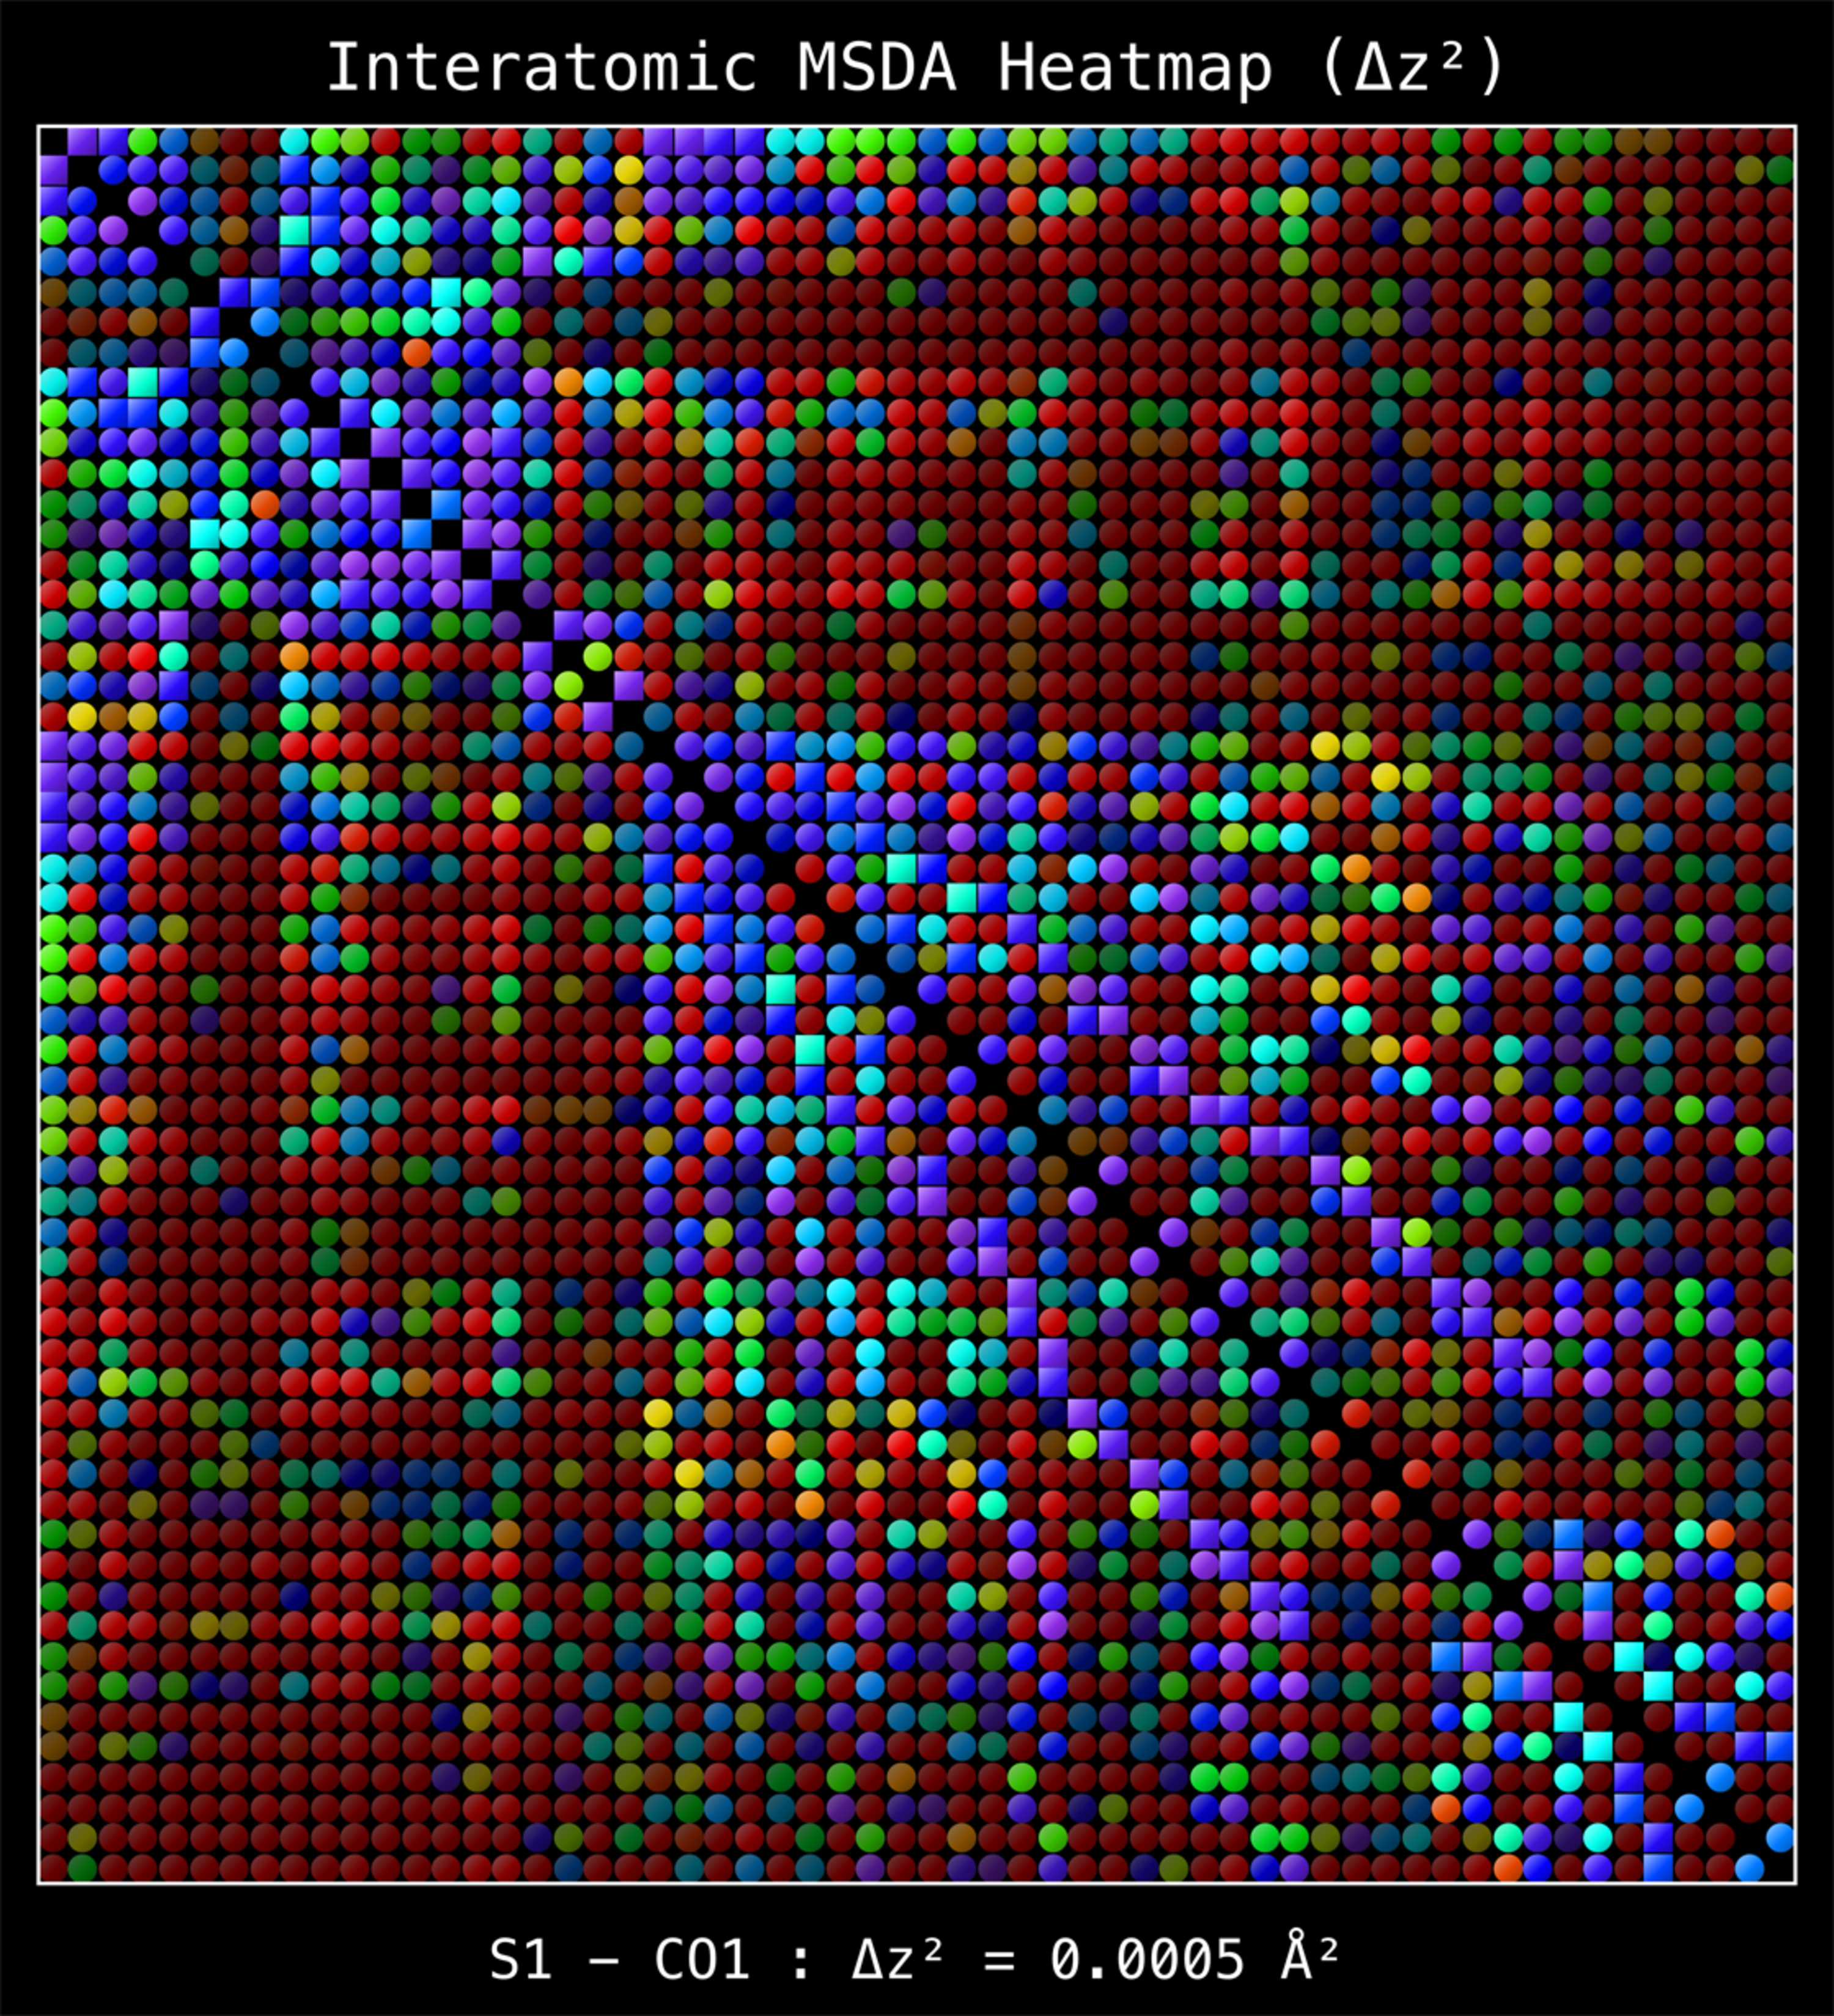
Figure 16
An interatomic `heatmap' of Δz2 (mean-square displacement differences) for the cobalt complex shown in Fig. 15  . Squares and circles correspond to bonded and non-bonded atom pairs, respectively. Cell colours are on a spectrum from violet/blue (low Δz2) to red (high Δz2), and are dimmed as a function of distance. |
 | JOURNAL OF APPLIED CRYSTALLOGRAPHY |
ISSN: 1600-5767
 access