

 menu


a tribute to George Sheldrick
 | JOURNAL OF APPLIED CRYSTALLOGRAPHY |
 access
PrimeXP: Python retro-interactive model editor, inspired by XP

aDepartment of Chemistry, University of Kentucky, Lexington, KY 40506-0055, USA
*Correspondence e-mail: [email protected]
This article is part of the collection A Tribute to George Sheldrick: the Legacy of a Crystallographic Computing Pioneer.
PrimeXP is an open-source Python/OpenGL interactive molecular graphics and analysis program, ostensibly for small-molecule crystallography, that was inspired by George Sheldrick's classic XP program. It uses a hybrid interface, pairing a bash-like terminal for command entry and feedback with a fully interactive graphical display. PrimeXP includes a wide array of tools to render multi-level electron-density maps, evaluate solvent-accessible and interstitial void spaces, and generate high-resolution, publication-quality diagrams (including ellipsoid, polyhedron and Bürgi-style `peanut' displacement surfaces). With its emphasis on visual feedback, PrimeXP provides experts with powerful analytical tools while offering students an intuitive learning environment. The program runs on Mac, Linux and Windows.
1. Introduction
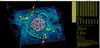
PrimeXP is an interactive crystal structure visualization and analysis program that incorporates editing, molecular and crystal packing graphics, electron density and void-space plots, and a few non-graphical analysis tools. It uses a hybrid user interface that pairs a graphics window with a bash-style terminal emulator. As such, it has some intentional resemblance to the program that inspired it, George Sheldrick's classic small-molecule Fortran program XP (Sheldrick, 2008 ). The on-screen layout is shown in Fig. 1. PrimeXP includes many of the same four-letter commands as XP, though some have altered and/or expanded functionality. There are also a number of new commands (to preserve the legacy, all four letters), which serve as extensions and/or enhancements. Specific omissions in PrimeXP are the slew of now obsolete printer and pen plotter routines.
|
Figure 1
The PrimeXP user interface. Graphics window on the left, bash-like terminal emulator on the right. |
1.1. Reminiscences of George Sheldrick and his programs, especially XP
My introduction to George's software, and specifically XP, was in 1989 when I joined Håkon Hope's group at UC Davis. While navigating XP I sensed a genuine affinity for the rigour of crystallography, as well as an aptitude for it. A surprising personal connection emerged shortly thereafter during a visit back to England in the early 1990s. While explaining my research in Håkon's lab to my parents, I mentioned George's software, which prompted an immediate shock of recognition from my father. He had worked alongside an older Sheldrick at Imperial Chemical Industries (ICI), Huddersfield, in the late 1950s. I knew George grew up in Huddersfield from one of his former students, Frank Pauer, then a post-doc in Philip Power's group at UC Davis, who frequented Håkon's X-ray lab. Anyhow, we strongly suspected that the older Sheldrick was George's father.
The last time I spoke at length with George was at the 2016 Denver ACA meeting. Our interaction proved pivotal for a frustrating crystallographic project: a 1.1 Å structure of a mithramycin complex. This large but nevertheless `small' molecule, an antibiotic derivative with a little over 400 non-H atoms, was also twinned by pseudo-merohedry (Parkin, 2021). Despite several attempts with an older version of SHELXD (Schneider & Sheldrick, 2002), I had had little luck obtaining a solution. George expressed some surprise, suggested the latest (2013) version and to persevere. The structure solved, albeit poorly, within an hour. Subsequent parameter tweaks to the SHELXD input file led to several viable solutions in just a few minutes. I wrote a quick Fortran program to average the best solutions and refined from there. Without that gentle prod from George, the structure solution (Hou et al., 2019) would have likely never happened.
During that same conversation, I asked George about the ICI Huddersfield connection, which he happily confirmed. Since we had just been discussing his programs, I lamented the loss of XP. It was deprecated, never to be updated again, so I offered to take over its maintenance. George revealed that he no longer had the source code and doubted anyone at Bruker possessed it either. He brought up ShelXle (Hübschle et al., 2011), which was already a mainstay of my workflow, but I pointed out its distinct limitations with labelled ellipsoid plots. To my mind, nothing quite beat TELP in XP. That the source code for such an important crystallographic tool could be `lost' is a stark reminder of the cost of closed-source software. Hence the impetus for PrimeXP, which will always be free and open source.
1.2. PrimeXP features
My original intention for PrimeXP was to provide a tool to replace the ellipsoid and packing diagram facilities of XP, but in a way that could be quickly and easily revised, updated and expanded. As such, PrimeXP would bridge the gap between SHELXL (Sheldrick, 2015) refinement and publication-quality diagrams in much the same way as XP. It has since grown into rather more than that. PrimeXP reads SHELXL *.res, writes *.ins files and extracts valid SHELXL files embedded within a .cif. It also handles a few other common formats for input (SHELXL `LIST 6' style .fcf for electron-density maps) and output (.xyz, .mol, .ort and, for graphics, .png). PrimeXP is not intended as a direct competitor to other cross-platform programs such as ShelXle or Olex2 (Dolomanov et al., 2009), or analysis tools like Mercury (Macrae et al., 2020) or Platon (Spek, 2003; Spek, 2020), but there is some overlap. While highly automated graphical user interface (GUI)-centric programs may offer modern editing facilities, their heavily abstracted approach can be a buffer to the underlying crystallographic mechanics, especially for students who actually want to understand the science. Regardless, for some complex symmetry-related model manipulations, the command-line approach used by XP remains superior for experienced users in the same way that command-line computing can be dramatically more efficient than hunting and pecking through a GUI. PrimeXP aims to replicate and build upon that type of functionality. PrimeXP is therefore much more closely related to XP than to other programs. For example, similar to XP, PrimeXP is not a GUI to the SHELX suite. It does not, for example, call external programs such as SHELXL. It does, however, provide a wide array of structure drawing and analysis tools that seek to match or surpass other small-molecule molecular graphics programs. This paper describes some of the features of PrimeXP using test structures mostly drawn from my career over the past three and a half decades, while hopefully honouring George and the legacy of XP. Since words are worth one thousandth of a picture, the presentation is heavy on graphics.
2. PrimeXP molecular graphics
Visualization in PrimeXP is handled by OpenGL4.1 and PyQt6 (https://www.riverbankcomputing.com/software/pyqt/). The wireframe view used by XP, with click-button-driven rotation, is replaced in PrimeXP by fully interactive rotation and zoom for all regular viewing modes, including wireframe, sticks, ball and stick, ellipsoids, and even Bürgi-style peanuts (Hummel et al., 1990). These styles are highly customizable: virtually all control parameters can be individually configured. Real-time application of space-group symmetry and cell translations for packing plots etc. are handled seamlessly. More advanced visuals, including multi-level electron density, void-space analysis etc. are also fully 3D interactive. Colours in PrimeXP may be specified by six-digit or three-digit hexcodes (∼16 million and ∼4 thousand colours, respectively), or by name for 148 colours commonly used in web-based documents and applications. The 15 atom rendering styles in XP (ATYP command) are expanded to 29 styles in PrimeXP so as to include 3D-shaded ellipsoids and various stylings of Bürgi peanuts. The seven bond drawing styles (JOIN command) of XP are also present in PrimeXP and can each be rendered with different colouring and/or shading styles. Output to high-resolution publication-quality PNG (portable network graphics) format files is achieved by the DRAW command. Restriction to PNG was intentional. It is lossless, compresses better than other common rasterized formats, does not degrade on sequential editing and can be converted to other formats easily if need be. This section showcases a few common types of molecular structure diagrams available in PrimeXP.
2.1. Ellipsoid plots
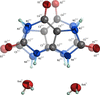
One powerful feature of XP was that publication-quality figures could easily be generated with simple instructions and minimal typing. In XP, ellipsoid plots were created by the TELP command after finding a suitable wireframe orientation with the rotation click buttons. In PrimeXP, TELP sets the graphics background to white and displays ellipsoids but is otherwise just another interactive 3D mode. Any of the atom and/or bond styles may be combined, and user preferences may be set via configuration files. The resulting view may then be fine-tuned either by terminal command or by click-button action. The structure of uric acid dihydrate (Parkin & Hope, 1998), a simple small molecule that happened to be twinned by pseudo-merohedry and exhibited whole-molecule disorder, will serve as an example (Fig. 2). In the figure, the minor disorder component is drawn with semi-transparent shaded ellipsoids, while the major has fully opaque ellipsoids with principal ellipses for carbon and ORTEP-style (Johnson, 1965) octant cutouts for nitrogen and oxygen. The ellipsoid probability percentage is set by the ADPS command and can take any value from 1 to 99%. To generate the image, TELP mode was invoked and partial transparency set for the minor disorder component (COLR CPK 0.666 PART 2) by simple commands in the terminal window (here, 0.666 is the `alpha channel' opacity). Other changes involved removal of the axis `gnomon', setting the view to `orthogonal', bond-rendering set to `blend', display of PART and RESI label superscripts ('tags'), and label position optimization by button clicks and mouse dragging. The output .png file (via DRAW Figure-2) is created on a virtual display by invisibly scaling the graphics window (default 5000 pixels), removing the yellow click buttons, trimming all blank space and adding a narrow (20 pixel default) border, before saving the image file. As with XP, the SAVE command allows easy retrieval of the graphics state. The syntax of each command is immediately accessible via the HELP command, a drop-down menu or the manual (see the supporting information).
|
Figure 2
An ellipsoid plot (50% probability) of uric acid dihydrate. The major disorder component is drawn with fully opaque 3D ellipsoids, principal ellipses and octant cutouts. The minor is drawn as semi-transparent 3D-shaded ellipsoids. Bond colours blend as seamless gradients. The SHELXL-designated PART and RESI numbers are indicated by superscript `tags'. Hydrogen atoms are drawn as arbitrary spheres. |
2.2. Bürgi-style 'peanut' plots
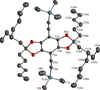
An alternative way of visualizing anisotropic displacement parameters (ADPs) is in the form of mean-square displacement (MSD) and root-mean-square displacement (RMSD) surfaces, introduced by Professor Hans-Beat Bürgi (Hummel et al., 1990). Rather than representing ADPs as probability ellipsoids, their program, Peanut, rendered atomic displacement as effective radius vectors, creating pinched dumbbell (prolate) or corpuscle (oblate) ovoid shapes reminiscent of unshelled peanuts. PrimeXP revives this approach via the PNUT command. An example with RMSD peanuts is shown in Fig. 3 for a substituted benzobisdioxole structure (Dutta et al., 2009). As with other graphical modes, PNUT in PrimeXP is fully 3D interactive. These `peanut' renditions have the intriguing property that, unlike equi-probability ellipsoids, they may even be calculated if the 3 × 3 matrix describing a particular ADP tensor happens to be non-positive definite. The resulting surface (fourth-order polynomial for RMSD, sixth-order for MSD) always remains a closed, finite envelope.
|
Figure 3
An example of RMSD shaded `peanuts', rendered with an overlaid mesh (ATYP -12) for a substituted benzobisdioxole compound. Deviations from the familiar ellipsoid shapes are most pronounced in the trimethylsilyl and alkyl chain groups. Hydrogen atoms are suppressed to enhance clarity. |
2.3. Polyhedron plots
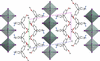
For many inorganic or organometallic coordination compounds, the geometry at metal centres is best emphasized by convex polyhedra centred on the metal atom(s). An example of such a view, drawn down the a axis, for a di-periodic organic–inorganic pseudo-perovskite with layers of SnI6 octahedra separated by 2-(4-methoxyphenylethylamine) organic spacers (Hossain et al., 2024), is shown in Fig. 4. This diagram also shows how atom styles (50% ellipsoids for Sn and I; MSD peanuts for the organic parts) may be freely combined.
|
Figure 4
A mixed-style plot of a di-periodic pseudo-perovskite layered structure viewed along the a axis, showing SnI6 units as transparent shaded octahedra, Sn and I atoms rendered as 50% probability ellipsoids, and organic spacer groups drawn as MSD `peanuts', scaled by a linear factor of 1.26 (i.e. a volume scale of ∼2). |
3. Packing diagrams
Beyond generic views projected along each of the crystallographic axes, packing diagrams often require custom dotted or dashed etc. bond styles or related means of emphasizing different types of interaction. A notable aesthetic feature of dotted and dashed bonds in PrimeXP is that, as the view orientation changes, the number of dots and/or dashes adapts, so as to prevent the dots/dashes from coalescing into continuous lines when viewed at a glancing angle.
3.1. JOIN/X – nearest-neighbour custom `bonds'
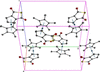
Metallocenes are often drawn with dotted or dashed lines to represent the interaction of metal centres with arene-ring π-clouds. PrimeXP includes several ways to add and edit custom bond styles, using the terminal and via click buttons. An example is shown in Fig. 5, which displays packing in a ruthenium sandwich complex (Pokharel et al., 2026b). Each of the basic four-letter commands used to generate the plot has a counterpart in the original XP, but PrimeXP includes extra qualifiers that add new and powerful functionality. For example, in XP, the RING command merely changed the bond style for atoms bonded to form rings. In PrimeXP, the RING/X command automatically places a dummy `X' atom at ring centroids. If no atoms are specified, it does this for all rings (default 3–8 membered, but configurable) in the structure. The JOIN/X command modifies the usual JOIN to act as a `nearest-neighbour join'. In the above, such a command (here, JOIN/X 3 2 Ru1 X*) tells PrimeXP to add new bonds (as per XP, style 3 = dashes) between Ru1 and the two nearest dummy X atoms. To pack the unit cell, the MGEN/B command generates symmetry equivalents, with the /B flag forcing the program to preserve the custom bond styles (/B is also available to extend the XP-like commands FMOL and SGEN). In addition to `nearest-neighbour join', PrimeXP also includes flags for `star join' and `π-stacking join' (JOIN/S and JOIN/P, respectively), vide infra.
|
Figure 5
A packing plot of a ruthenium cyclopentathiophenedione/cp* sandwich complex. Custom bonds are maintained through the symmetry-equivalent generation step by means of MGEN/B, where the /B flag ensures bond-style preservation. |
3.2. JOIN/S – `star join' custom `bonds'
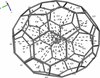
The metallocene example in Fig. 5 could also have been prepared using the `star join', which provides a rapid means of joining a central `hub' atom to a group of others, like a multi-pointed star. However, the power and convenience of the star join is best illustrated with a more complicated example. Consider a fullerene molecule like C70, e.g., isolated from a much larger fourfold-disordered C70/buckybowl complex (Gao et al., 2020; Fig. 1). The task of finding the distance from the centroid of the whole C70 cage to the centroid of each of the fullerene 5- and 6-membered rings would have been tedious in the extreme in XP, but it is straightforward in PrimeXP, with minimal typing (Fig. 6). First, the fragment is isolated (FMOL PART -1), then the centroid of the C70 cage is assigned as dummy atom X1 (CENT/X), next the centroids of all 5- and 6-membered rings in the cage are assigned as sequential dummy X atoms (RING/X), and these are `bonded' to X1 using the `star join' (e.g. JOIN/S 6 X1 X*, where `6' denotes thin dashes). Lastly, the command BANG/L X1 gives the distance from X1 to all other X dummy atoms (the /L flag suppresses output of `bond' angles).
|
Figure 6
The use of RING/X and JOIN/S (star join) enables rapid placement of centroid dummy `atoms' and `bonds'. In C70, that amounts to 37 ring centroids, and bonding them to the cage centroid takes just a few simple commands. |
3.3. JOIN/P – π-stacking custom `bonds'
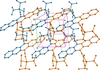
The remaining special variant of the JOIN command uses the /P flag to add `bonds' between ring centroids that meet user-specified criteria. Fig. 7 shows a packing plot of a substituted pentacene (Anthony et al., 2001; Payne et al., 2005), in which the pentacene groups stack to form di-periodic layers. The image was prepared by applying point symmetry (GROW), setting atom rendering as shaded spheres (ATYP 11), generating sufficient symmetry equivalents (MGEN 1 1 0.1 0.5 0.5 0), adding ring centroid dummies (RING/X) and employing the π-stacking join (JOIN/P 7 1 1 X* X*). The dummy atoms were made invisible (ATYP 0 X*) and the molecules were coloured by symmetry (via a click button). Disregarding translation, light blue indicates atoms at (x, y, z) and orange at (−x, −y, −z), information available via the SYMM command. The command syntax is explained in the PrimeXP manual in the supporting information.
|
Figure 7
An example of JOIN/P (π-stacking join) for a di-periodic `brickwork' packing motif in a substituted pentacene structure. |
3.4. HBND – automated depiction of hydrogen bonds
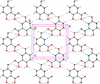
PrimeXP can automatically find and display both conventional hydrogen bonds (those having strong donors like OH and NH etc.) and weak hydrogen bonds (e.g. CH donors). The geometric criteria for each type are different; sensible default distance and angle parameters are stored as separate configuration parameters and may be edited to a user's own preferences or to accommodate unusual structures. An example is shown in Fig. 8 for 3,6-dihydroxypicolinic acid (Behrman & Parkin, 2021), in which N—H⋯O and O—H⋯O interactions are shown as solid dashes, and C—H⋯O are shown as hollow dashes via the simple command HBND 2 3 4. Here, the `2' specifies both conventional and weak hydrogen bonds, while the `3' and `4' specify the bond styles.
|
Figure 8
The di-periodic hydrogen-bonding network in 3,6-dihydroxypicolinic acid. Solid dashes represent conventional N—H⋯O and O—H⋯O hydrogen bonds while hollow dashes are weaker C—H⋯O interactions. |
4. Electron density plots
In XP, electron density maps could be calculated via the EDEN command, but these were limited to 2D contour maps calculated for a user-specified plane, the so-called `slant-Fourier' map.
4.1. 2D contour maps in PrimeXP
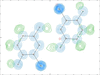
Nowadays, 2D slant-Fourier contour maps seem archaic, having been supplanted by 3D electron density maps. Nevertheless, in order to continue the legacy of XP, a means of plotting 2D contoured electron density maps is available in the EDEN command provided a suitable `LIST 6' format file is present. An example showing a hydrogen-bonded dimer of 6-chloro-2,5-dihydroxypyridine (Parkin & Behrman, 2009) is shown in Fig. 9, obtained via the commands EDEN 1 2D Figure-9.fcf and EDEN 2 2D Figure-9d.fcf, where the `1' specifies Fobs and `2' is Fobs–Fcalc. Thus, EDEN in PrimeXP can draw more than one type of 2D map on the same diagram, even using different .fcf files.
|
Figure 9
A 2D slant-Fourier electron density map of a 6-chloro-2,5-dihydroxy-pyridine dimer. Blue contours are Fobs and green are Fobs–Fcalc. The tick marks around the perimeter are spaced by 1 Å. |
4.2. 3D interactive electron density maps
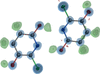
In modern software, static 2D electron density maps have been all but abandoned in favour of fully interactive 3D representations. In PrimeXP, these are available using a variant of the EDEN command(s) given above, but with `3D' specified. In three dimensions, Fobs and Fobs–Fcalc maps may be drawn with multiple σ levels (see the PrimeXP manual in the supporting information). An example for the same 6-chloro-2,5-dihydroxypyridine dimer displayed in two dimensions in Fig. 9 is shown in three dimensions in Fig. 10. In PrimeXP, the 3D contours may be drawn as wireframe cages, as transparent clouds or as a combination of the two, with cages superimposed on clouds. In both 2D and 3D modes, 2Fobs–Fcalc maps are also available.
|
Figure 10
A fully interactive 3D electron density map of a 6-chloro-2,5-dihydroxy-pyridine dimer. Blue-shaded cage contours are Fobs and green are Fobs–Fcalc. |
5. Void-space analysis
The same rendering mechanism as used for electron density display is also used for void-space analysis. Similar to other programs such as Platon and Mercury, PrimeXP uses a rolling-probe algorithm. However, it is able to evaluate a full continuum of probe parameters, mesh resolution and minimum targeted volume. At one extreme the algorithm maps broad solvent-accessible cavities, while at the other it quantifies tight interstitial voids. A special case of the VOID command (VOID FLIP) inverts the displayed voids, e.g., to show the van der Waals envelope.
5.1. Solvent-accessible voids
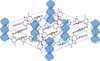
For solvent-accessible void analysis, the default probe is a sphere of radius 1.2 Å, with a minimum probed volume of 10.0 Å3, which ensures that small interstitial volumes are skipped. The default mesh size of 0.25 Å ensures rapid calculation, even for quite large unit cells with extensive void space. The user has the option of extending the graphical view of any voids beyond the primary unit cell, but the calculated void percentage reported in the terminal window is strictly per cell. An example of such a plot, drawn for 5-hydroxy-6-methyl-2-pyridone (Parkin & Behrman, 2011), is shown in Fig. 11. The crystals were trigonal, space group R3, with severely disordered acetone within channels running parallel to the c axis. For the plot, the modelled solvent was removed.
|
Figure 11
Solvent-accessible voids (blue-shaded cage contours) parallel to the c axis of 5-hydroxy-6-methyl-2-pyridone. Hydrogen atoms are omitted to enhance clarity. |
5.2. Interstitial voids
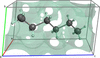
A chance meeting with Professor Andrzej Katrusiak at the 2026 Calgary IUCr meeting led to rapid adaptation of the VOID algorithm to accept a rolling probe of negligible (even zero) radius, a mesh size as small as possible given the constraint of 64 million voxels and zero minimum targeted volume. In this regime, interstitial voids may be effectively mapped and quantified. An example is shown in Fig. 12 for the structure of n-hexane compressed in a diamond anvil cell at 4.1 GPa (Katrusiak, 2026). The interstitial voids obtained are closely related to Kitaigorodsky's packing index and provide a direct three-dimensional visualization of the unoccupied space that defines the packing efficiency (Kitaigorodsky, 1961).
|
Figure 12
Interstitial voids (custom colour, hexcode #44cc88, set as a user preference) in a high-pressure (4.1 GPa) structure of n-hexane, courtesy of Professor Andrzej Katrusiak. |
6. Modular graphics in PrimeXP
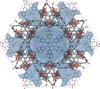
All graphical elements in the main display window of PrimeXP are independent. As such, they may be combined as the user sees fit. An example of an unusually complex diagram is given in Fig. 13, which shows a metal–organic framework (MOF) structure (He et al., 2013) with a very high symmetry cubic space group, Pn3n (No. 222), viewed along [111]. The asymmetric unit of this structure comprises just 17 non-H atoms but grows via the default MGEN command to 1632 atoms. The image shows the large solvent-accessible voids characteristic of MOFs (pale transparent blue), non-H atoms depicted as RMSD peanuts and square-based pyramidal polyhedra for Cu atoms (transparent orange), all in orthogonal projection with the unit cell visible.
|
Figure 13
An unusually complex, very high symmetry MOF structure drawn with just a few simple terminal commands. Atoms (H suppressed) are rendered as RMSD peanuts, solvent-accessible voids are light blue and polyhedra at Cu atoms are orange. |
7. Other analysis tools
PrimeXP includes all the old non-graphical geometry calculations of XP, namely BANG (bond lengths and angles), TORS (torsion angles), MPLN (mean planes), LINE (line lengths and angles) and NEWM (Newman projections). It also includes ring puckering parameters following the Cremer & Pople (1975) method (command CPOP) and the less well known but superior conformational analysis described by Zefirov et al. (1990) (command ZPAD). Additional tools are under active development.
7.1. Thermal-motion analysis
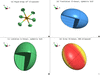
PrimeXP retains the LIBR command of XP, which performed thermal-motion analysis in the form of translation, libration and screw tensors (TLS), following the treatment of Schomaker & Trueblood (1968) in their seminal program THMA11. The implementation provides numerical details of each tensor, extensive error trapping and bond-length corrections for libration. It also generates an interactive four-quadrant `dashboard' to visualize the rigid group and the TLS tensors. An example is shown in Fig. 14 for a [PF6]– anion from a recent structure (Pokharel et al., 2026a). Valid T and L tensors can be represented by 3 × 3 symmetric positive-definite matrices and so may be visualized as ellipsoids, similar to atomic displacement parameters. The S tensor, however, which represents the coupling of translation and rotation, in general requires a non-symmetric 3 × 3 matrix. It came as something of a surprise, but in fact any real 3 × 3 matrix can be represented as an ellipsoid, just not in the way understood by most crystallographers. The trick is to treat the matrix as a transformation that perturbs a sphere, which is accomplished by singular-value decomposition [SVD; see e.g. Strang (1993)]. While the SVD process does not preserve information about the handedness of screw motion, that chirality is still present in the underlying S tensor. In PrimeXP, the handedness is analytically recovered by projecting the screw pitch (p = nTn) along the surface normal as directionally encoded colour (DEC; Pajevic & Pierpaoli, 1999). The default colours are red (r, right-handed) and lemon yellow (l, left-handed). Sharp transitions between these extremes are indicative of relatively long screw pitches and muted transitions by shallow pitch.
|
Figure 14
The LIBR command's graphical `dashboard'. (a) An ellipsoid plot of the rigid group under investigation. (b, c) The translation (T) and libration (L) tensors (both symmetric 3 × 3) rendered as ellipsoids. (d) The S tensor (screw) rendered as an SVD ellipsoid with DEC to indicate screw handedness (red = right, lemon yellow = left). All four quadrant views rotate and zoom in unison via mouse action. |
7.2. Extended Hirshfeld rigid-body analysis
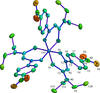
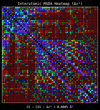
The Hirshfeld rigid-bond test (Hirshfeld, 1976) posits that covalently bonded atoms should move as a rigid unit. This condition requires that their mean-square displacement amplitude difference (Δz2) along the bond should be nearly zero and for non-hydrogen atoms should not exceed ∼0.001 Å2. Although this is a property of atom pairs, to gain some qualitative insight, PrimeXP allows for bonds to be coloured as a function of Δz2, on a spectrum from violet (good fit) to red (poor fit). As complementary visual information, the magnitude of ADPs may also be used to colour the atoms themselves. Both of these visual cues are accessed via click buttons. An example, for a trigonal (P3) cobalt complex with N,N-diethyl-N′-[(4-nitrophenyl)(oxo)methyl]carbamimidothioate (Roecker & Parkin, 2024) is shown in Fig. 15. The RIGB command writes a table of Δz2 values to the terminal window, with the atoms involved and their bond lengths. As pointed out by Dr Paul Boyle early in the development of PrimeXP, the output log file of THMA11 contained a triangular matrix of mean-square displacement amplitude (MSDA) values, which are directly related to the Hirshfeld test. In PrimeXP, these values are plotted on a square matrix as a `heatmap' by the RIGB/H command. An example heatmap for the trigonal cobalt structure in Fig. 15 is given in Fig. 16. Bonded pairs are drawn as coloured squares and non-bonded pairs as circles. By default the heatmap cells are dimmed as a function of increasing interatomic distance. A click button cycles through dimming by distance, proximity and no dimming. A mouse click on any matrix cell writes the Δz2 value for the atom pair on the RIGB dashboard.
|
Figure 15
An ellipsoid plot (30% probability) of tris{N,N-diethyl-N′-[(4-nitrophenyl)(oxo)methyl]carbamimidothioato}cobalt(III), with bonds coloured by values derived from the Hirshfeld rigid-bond criteria and atom colours derived from their Ueq or Uiso values. |
|
Figure 16
An interatomic `heatmap' of Δz2 (mean-square displacement differences) for the cobalt complex shown in Fig. 15 . Squares and circles correspond to bonded and non-bonded atom pairs, respectively. Cell colours are on a spectrum from violet/blue (low Δz2) to red (high Δz2), and are dimmed as a function of distance. |
8. Conclusion
PrimeXP began as an effort to revive the ellipsoid and packing diagram capabilities of George Sheldrick's classic XP program. By pairing a bash-style terminal with fully interactive, modern 3D graphics, PrimeXP expands the core elements of XP while eliminating obsolete features. A core design philosophy of PrimeXP is transparency. While graphical interface abstraction might be convenient, some popular GUIs obfuscate the underlying crystallographic mechanics, thereby hindering true understanding. PrimeXP resists the `black box' approach: everything is open and auditable. Ultimately, my goal for PrimeXP is to ensure that the legacy of XP, and the efficient workflow it championed, is not lost. PrimeXP is free, open-source software and is under constant development. Source code, comprehensive documentation and installation instructions are available at the URL below or by e-mail to the author. New feature requests and especially bug reports are welcome. The download site is https://xray.uky.edu/Resources/programs/primeXP.html
9. Supporting information
The supporting information consists of three files, the PrimeXP manual in PDF format, the license txt file (GNU GPLv3) and a readme document with some installation tips etc. More details are on the official download site: https://xray.uky.edu/Resources/programs/primeXP.html. If you download the program, please let me know by e-mail at [email protected].
Supporting information
PrimeXP Reference Manual. DOI: https://doi.org/10.1107/S1600576726009696/he5700sup1.pdf
License file (GNU GPLv3). DOI: https://doi.org/10.1107/S1600576726009696/he5700sup2.txt
README.md file. DOI: https://doi.org/10.1107/S1600576726009696/he5700sup3.txt
Acknowledgements
I am indebted to many people for input during the development of PrimeXP. Early independent testing by Drs Paul Boyle, Sanjay Dutta, Steven Kelley, Maxime Siegler, Youselie Joseph and Sean Gilpatrick helped to squelch a number of serious and benign bugs and ensure cross-platform performance. Subsequent suggestions by all of the above and also by Drs Carol Brock, Bill Dougherty, Gary Nichol, Simon Parsons, Andrzej Katrusiak, Kuldeep Mahiya and several others who I failed to note down (my apologies) are also gratefully acknowledged. The development of PrimeXP made use of Gemini AI for some carefully vetted code-generation tasks, debugging, refactoring and algorithm research.
References
 Anthony, J. E., Brooks, J. S., Eaton, D. L. & Parkin, S. R. (2001). J. Am. Chem. Soc. 123, 9482–9483.
Web of Science
CSD
CrossRef
PubMed
CAS
Google Scholar
Cremer, D. & Pople, J. A. (1975). J. Am. Chem. Soc. 97, 1354–1358.
CrossRef
CAS
Web of Science
Google Scholar
Dolomanov, O. V., Bourhis, L. J., Gildea, R. J., Howard, J. A. K. & Puschmann, H. (2009). J. Appl. Cryst. 42, 339–341.
Web of Science
CrossRef
CAS
IUCr Journals
Google Scholar
Dutta, T., Woody, K. B., Parkin, S. R., Watson, M. D. & Gierschner, J. (2009). J. Am. Chem. Soc. 131, 17321–17327.
CrossRef
PubMed
CAS
Google Scholar
Gao, G., Chen, M., Roberts, J., Feng, M., Xiao, C., Zhang, G., Parkin, S., Risko, C. & Zhang, L. (2020). J. Am. Chem. Soc. 142, 2460–2470.
CrossRef
CAS
PubMed
Google Scholar
He, Y., Guo, Z., Xiang, S., Zhang, Z., Zhou, W., Fronczek, F. R., Parkin, S., Hyde, S. T., O'Keeffe, M. & Chen, B. (2013). Inorg. Chem. 52, 11580–11584.
CrossRef
CAS
PubMed
Google Scholar
Hirshfeld, F. L. (1976). Acta Cryst. A32, 239–244.
CrossRef
IUCr Journals
Web of Science
Google Scholar
Hossain, T., Atapattu, H. R., Pruett, H., Rahman, M. T., Pedersen, K. R., Huckaba, A. J., Parkin, S. R. & Graham, K. R. (2024). Chem. Mater. 36, 11004–11014.
CrossRef
CAS
Google Scholar
Hou, C., Rohr, J., Parkin, S. R. & Tsodikov, O. (2019). MedChemComm 10, 735–741.
CrossRef
CAS
PubMed
Google Scholar
Hübschle, C. B., Sheldrick, G. M. & Dittrich, B. (2011). J. Appl. Cryst. 44, 1281–1284.
Web of Science
CrossRef
IUCr Journals
Google Scholar
Hummel, W., Hauser, J. & Bürgi, H. B. (1990). J. Mol. Graph. 8, 214–220.
CrossRef
CAS
PubMed
Web of Science
Google Scholar
Johnson, C. K. (1965). ORNL Report 3794. Oak Ridge National Laboratory, Oak Ridge, TN, USA.
Google Scholar
Katrusiak, A. (2026). Personal communication.
Google Scholar
Kitaigorodsky, A. I. (1961). Organic Chemical Crystallography. New York: Consultants Bureau.
Google Scholar
Macrae, C. F., Sovago, I., Cottrell, S. J., Galek, P. T. A., McCabe, P., Pidcock, E., Platings, M., Shields, G. P., Stevens, J. S., Towler, M. & Wood, P. A. (2020). J. Appl. Cryst. 53, 226–235.
Web of Science
CrossRef
CAS
IUCr Journals
Google Scholar
Pajevic, S. & Pierpaoli, C. (1999). Magn. Reson. Med. 42, 526–540.
CrossRef
PubMed
CAS
Google Scholar
Parkin, S. & Hope, H. (1998). Acta Cryst. B54, 339–344.
Web of Science
CSD
CrossRef
CAS
IUCr Journals
Google Scholar
Parkin, S. R. (2021). Acta Cryst. E77, 452–465.
Web of Science
CrossRef
IUCr Journals
Google Scholar
Parkin, S. R. & Behrman, E. J. (2009). Acta Cryst. C65, o529–o533.
Web of Science
CrossRef
CAS
IUCr Journals
Google Scholar
Parkin, S. R. & Behrman, E. J. (2011). Acta Cryst. C67, o324–o328.
Web of Science
CrossRef
CAS
IUCr Journals
Google Scholar
Payne, M. M., Parkin, S. R., Anthony, J. E., Kuo, C. C. & Jackson, T. N. (2005). J. Am. Chem. Soc. 127, 4986–4987.
CrossRef
PubMed
CAS
Google Scholar
Pokharel, U. R., Parkin, S. & Selegue, J. P. (2026a). Crystals 16, 201.
CrossRef
Google Scholar
Pokharel, U. R., Parkin, S. & Selegue, J. P. (2026b). Crystals 16, 409.
CrossRef
Google Scholar
Roecker, L. & Parkin, S. (2024). Acta Cryst. E80, 713–716.
CrossRef
IUCr Journals
Google Scholar
Schneider, T. R. & Sheldrick, G. M. (2002). Acta Cryst. D58, 1772–1779.
Web of Science
CrossRef
CAS
IUCr Journals
Google Scholar
Schomaker, V. & Trueblood, K. N. (1968). Acta Cryst. B24, 63–76.
CrossRef
CAS
IUCr Journals
Web of Science
Google Scholar
Sheldrick, G. M. (2008). Acta Cryst. A64, 112–122.
Web of Science
CrossRef
CAS
IUCr Journals
Google Scholar
Sheldrick, G. M. (2015). Acta Cryst. C71, 3–8.
Web of Science
CrossRef
IUCr Journals
Google Scholar
Spek, A. L. (2003). J. Appl. Cryst. 36, 7–13.
Web of Science
CrossRef
CAS
IUCr Journals
Google Scholar
Spek, A. L. (2020). Acta Cryst. E76, 1–11.
Web of Science
CrossRef
IUCr Journals
Google Scholar
Strang, G. (1993). Am. Math. Mon. 100, 848–855.
CrossRef
Google Scholar
Zefirov, N. S., Palyulin, V. A. & Dashevskaya, E. E. (1990). J. Phys. Org. Chem. 3, 147–158.
CrossRef
CAS
Web of Science
Google Scholar
This is an open-access article distributed under the terms of the Creative Commons Attribution (CC-BY) Licence, which permits unrestricted use, distribution, and reproduction in any medium, provided the original authors and source are cited.
| JOURNAL OF APPLIED CRYSTALLOGRAPHY |