

 menu
|
|
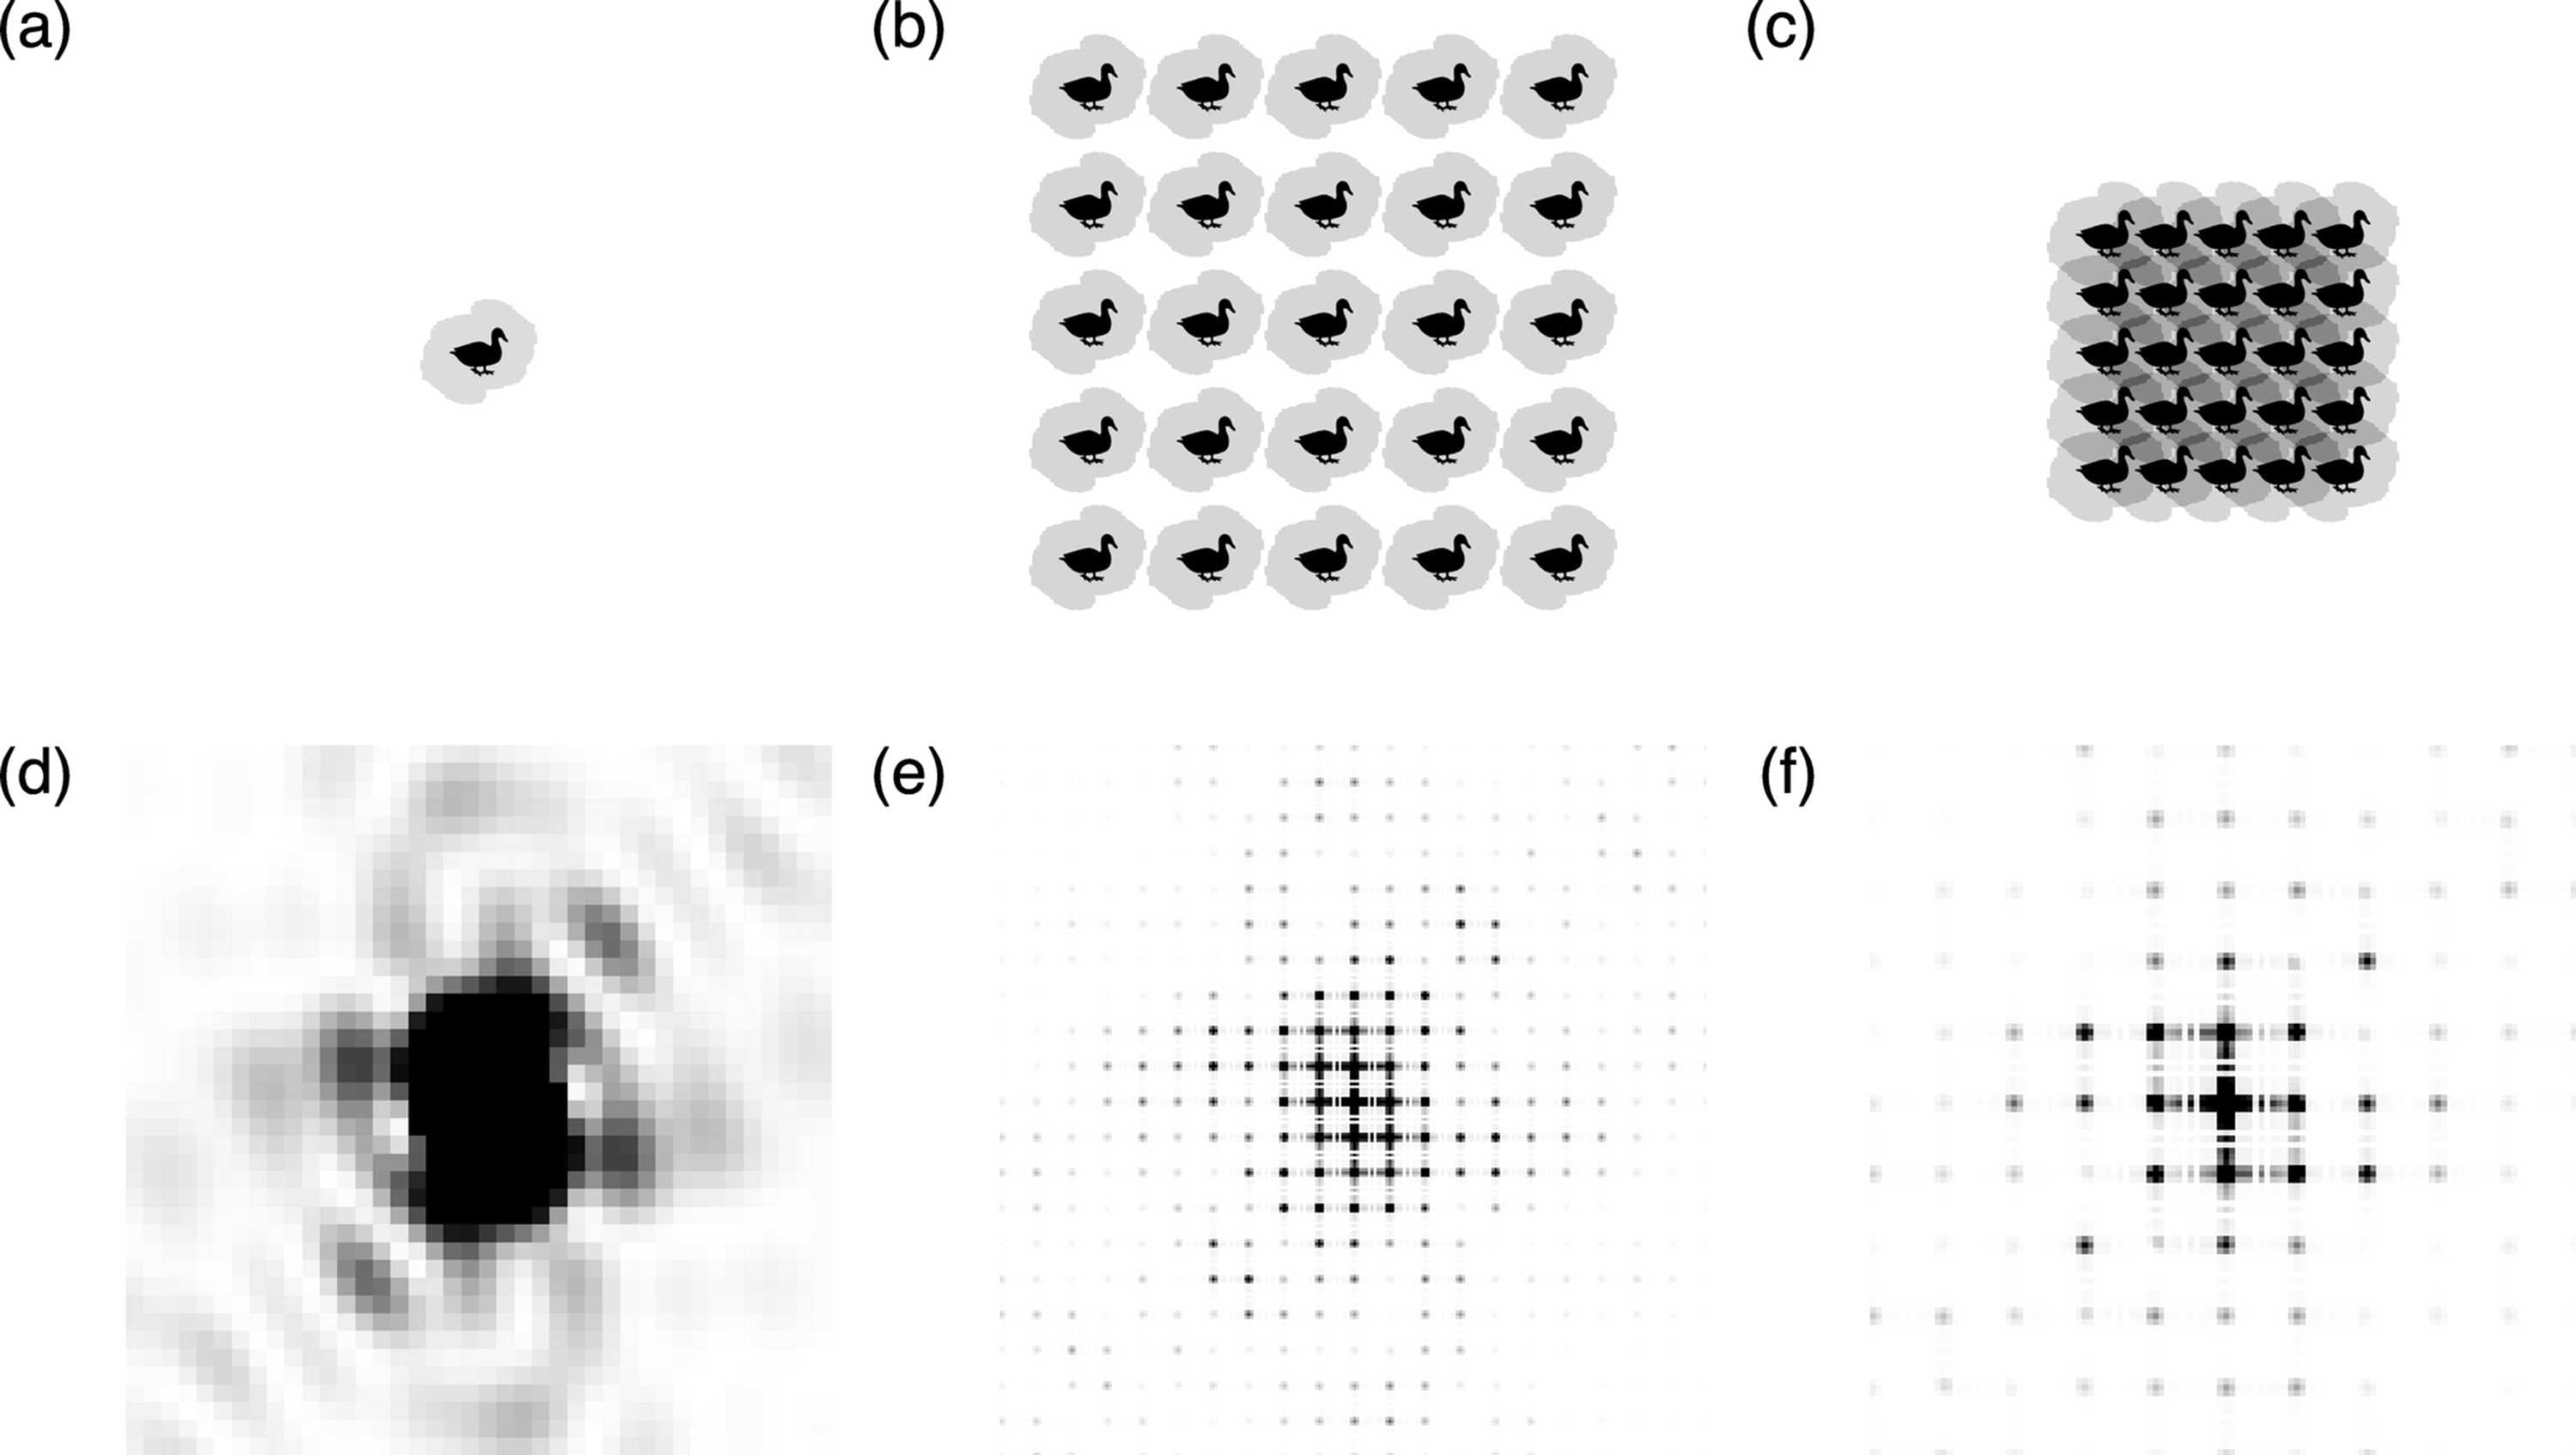
Figure 1
The top row (a, b, c) shows the duck-shaped `density' in black as well as the outline of the autocorrelation function in gray. The bottom row (d, e, f) shows the center of the Fourier transform of the respective `densities' above, where the intensity in the leftmost plot is enhanced by a factor of 1000 compared with the maximum of the other two plots. From left to right, we show a single duck (a), a  duck crystal with wide solvent spacing (b) and a duck crystal with tight solvent spacing (c). In the case of (b), the autocorrelation function fits well within the unit cell, whereas there is significant overlap in (c). As the unit cell contains more empty/solvent space, the duck's Fourier transform is thus sampled more finely in (e) than in (f). One can also see how the lattice peaks of (e) and (f) match the high- and low-intensity regions of the single-duck intensities in (c). |
 | JOURNAL OF APPLIED CRYSTALLOGRAPHY |
ISSN: 1600-5767
 access