

 menu
|
|
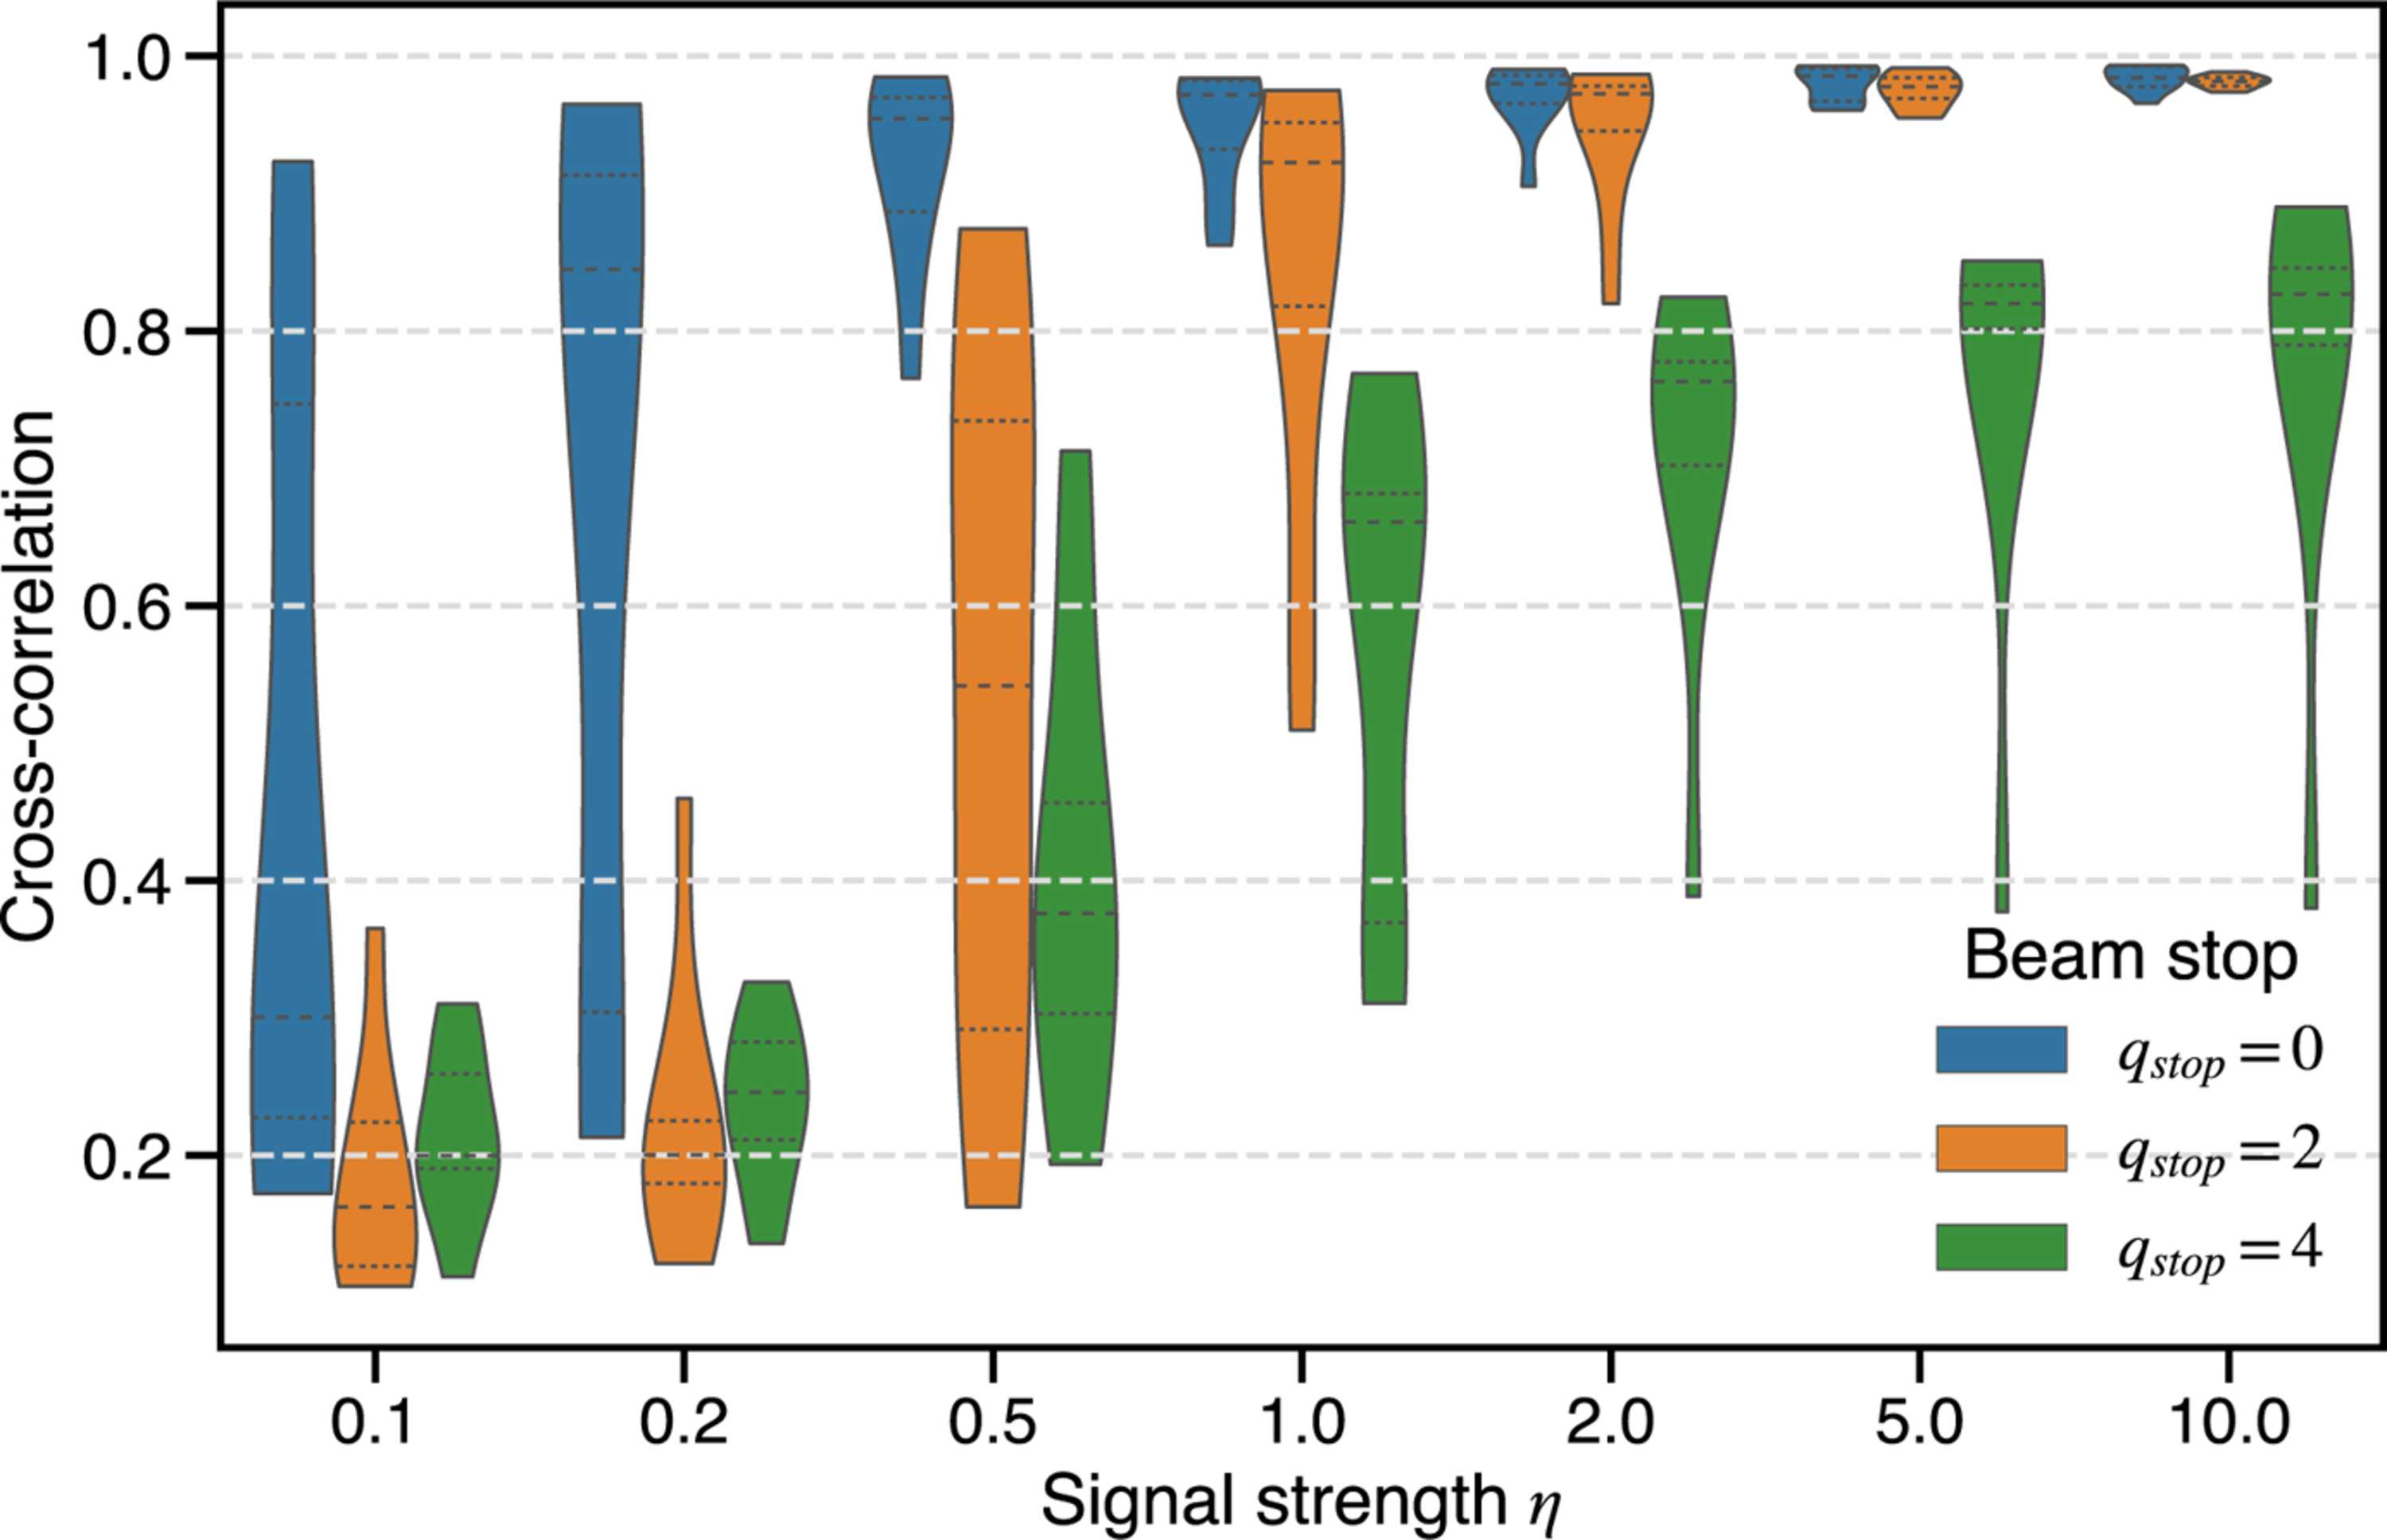
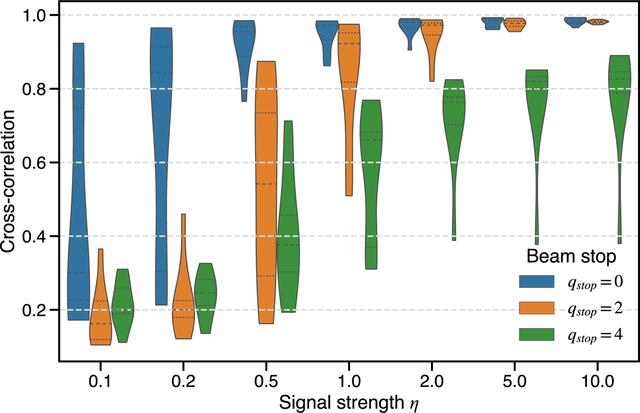
Figure 10
Effect of beamstop size and noise level on reconstruction performance. Each violin plot shows the distribution of CC between reconstructed and ground-truth electron densities across all test proteins for different SNRs η. |
 | JOURNAL OF APPLIED CRYSTALLOGRAPHY |
ISSN: 1600-5767
 access