

 menu
|
|
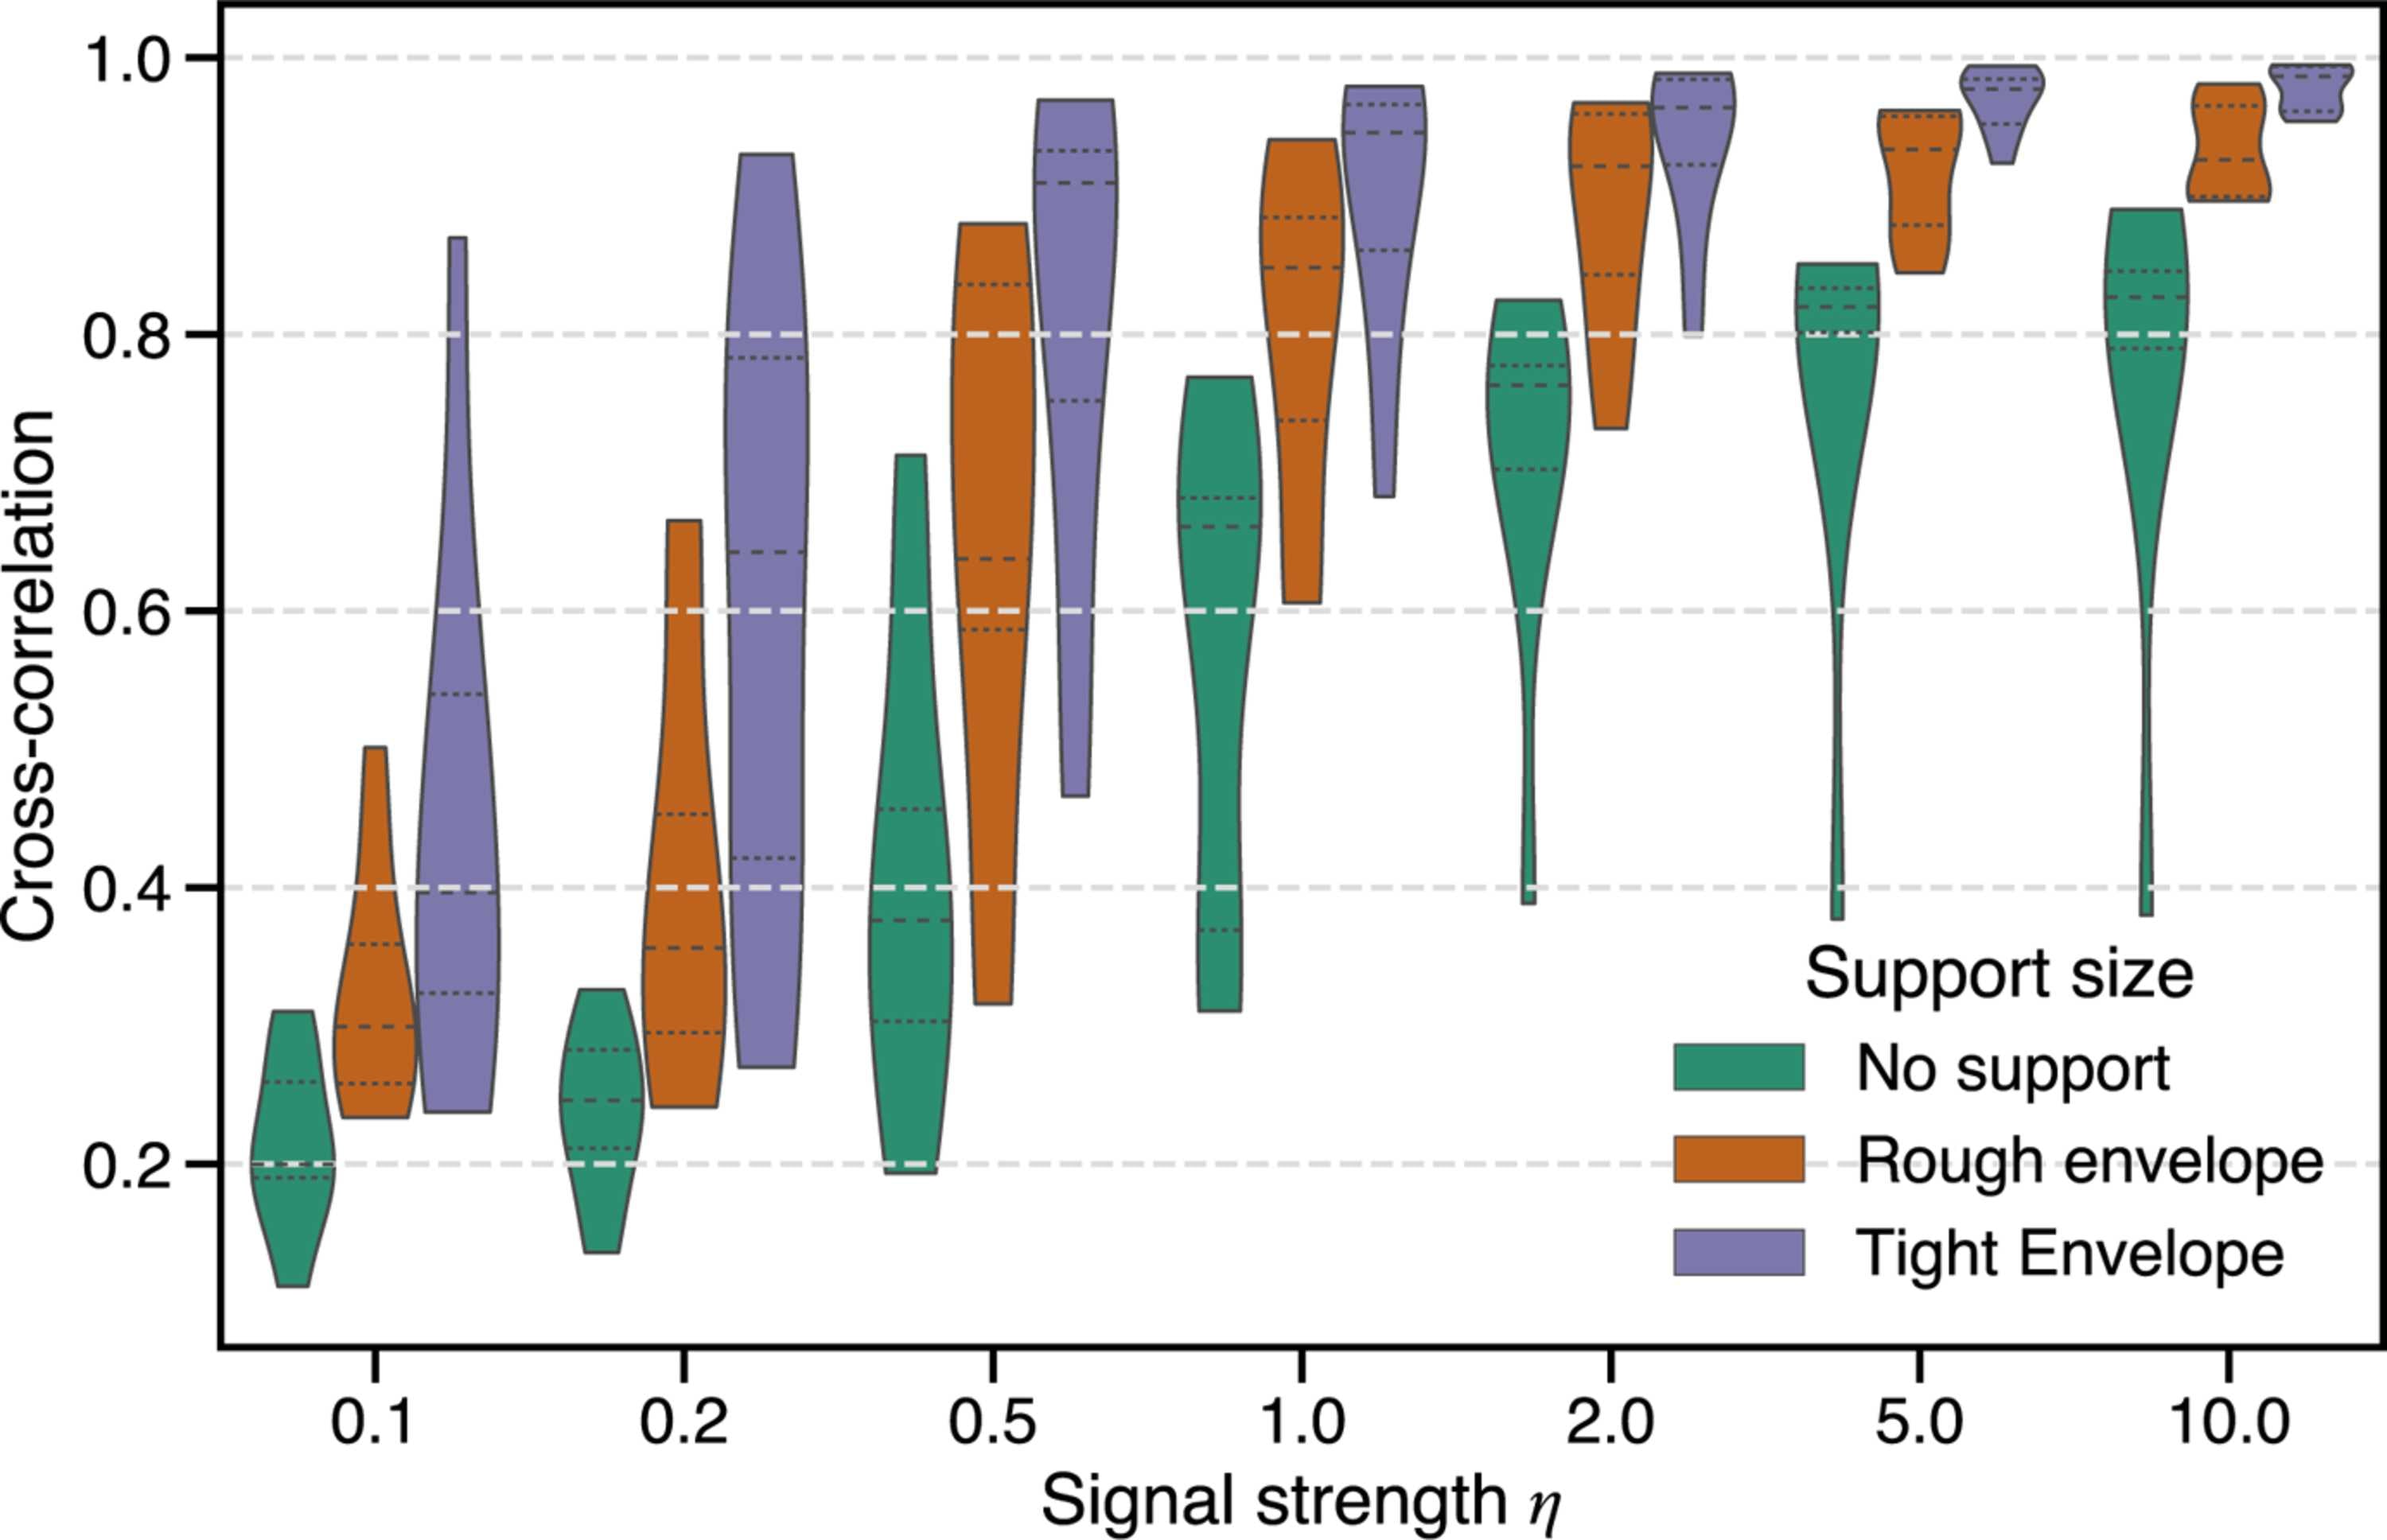
Figure 12
Influence of real-space support constraints on reconstruction accuracy at different noise levels. Violin plots show CC distributions for reconstructions performed without a support (green), with a rough molecular envelope including partial solvent density (orange) and with a tight envelope closely matching the true molecular shape (purple). All simulations were conducted with  . |
 | JOURNAL OF APPLIED CRYSTALLOGRAPHY |
ISSN: 1600-5767
 access