

 menu
|
|
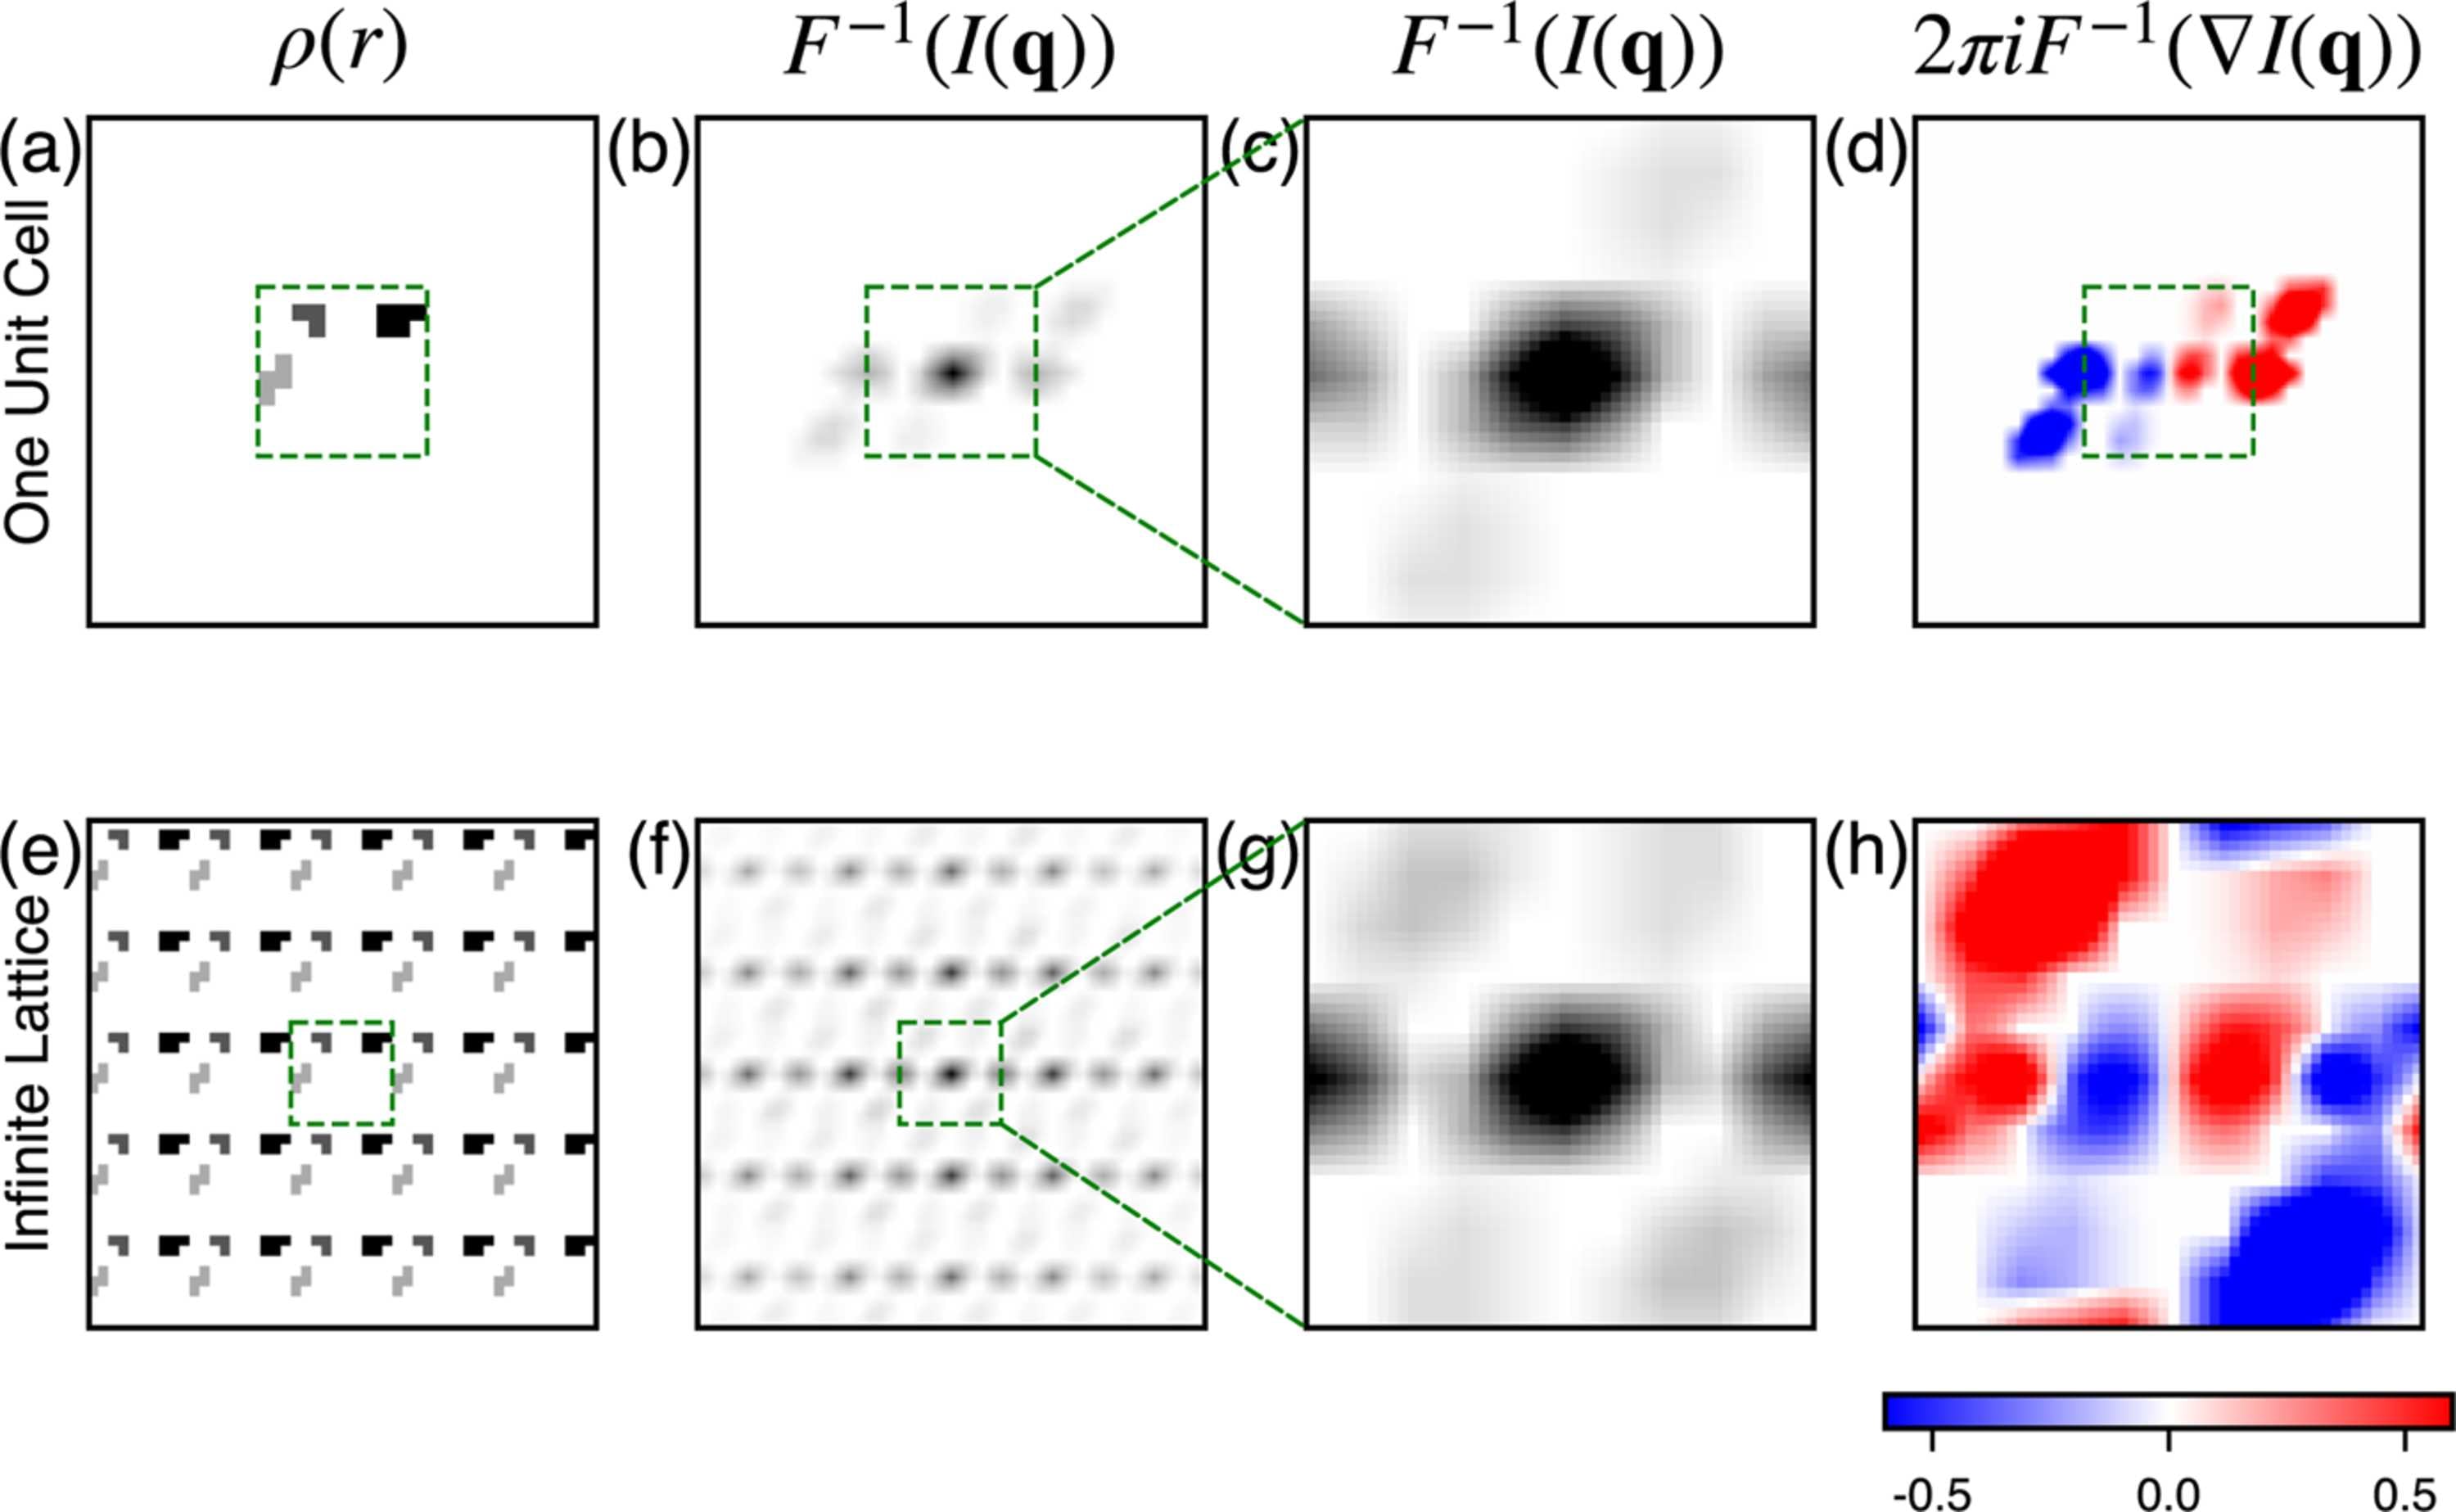
Figure 2
Functions calculated from an isolated unit cell of a toy molecule (top row) and from an infinite crystal of the same unit cell (bottom row). The dashed boxes represent the size of the unit cell. (a, e) Electron density; (b, f) autocorrelation function; (c, g) the lowest-order Wigner–Seitz cell of the autocorrelation function (i.e. centered on the origin); (d, h) inverse Fourier transform of the intensity gradients in the horizontal direction, shown within the lowest-order Wigner–Seitz cell. The color scale of the coordinate  is indicated below (h). |
 | JOURNAL OF APPLIED CRYSTALLOGRAPHY |
ISSN: 1600-5767
 access