

 menu
|
|
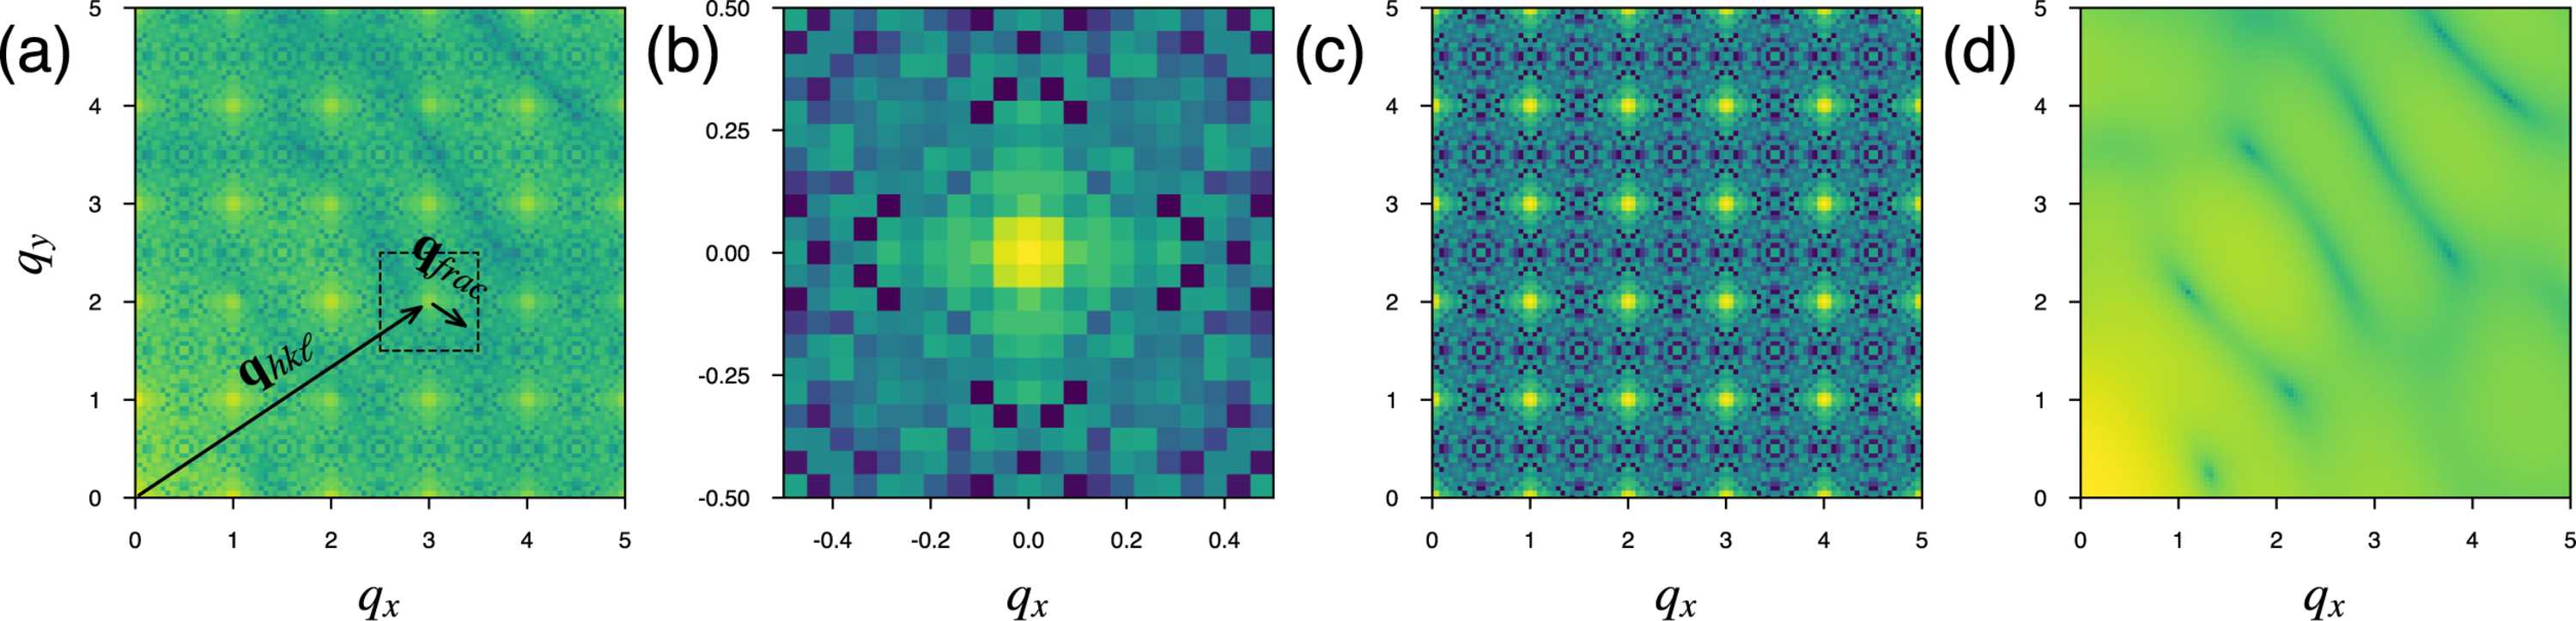
Figure 3
(a) Section of a noise-free diffraction pattern with Bragg peaks, i.e.  .  indicates the positions of the Bragg peaks and  indicates the fractional offset from the nearest Bragg peak. (b) The lattice shape transform, representing the average intensity relative to the nearest Bragg peak, i.e.  . (c) The intensity of the finite lattice transform, i.e.  . (d) Following Spence et al. (2011  ), equation (5) is rearranged to solve for the molecular intensity  . All intensity scales are presented on a logarithmic scale. |
 | JOURNAL OF APPLIED CRYSTALLOGRAPHY |
ISSN: 1600-5767
 access