

 menu
|
|
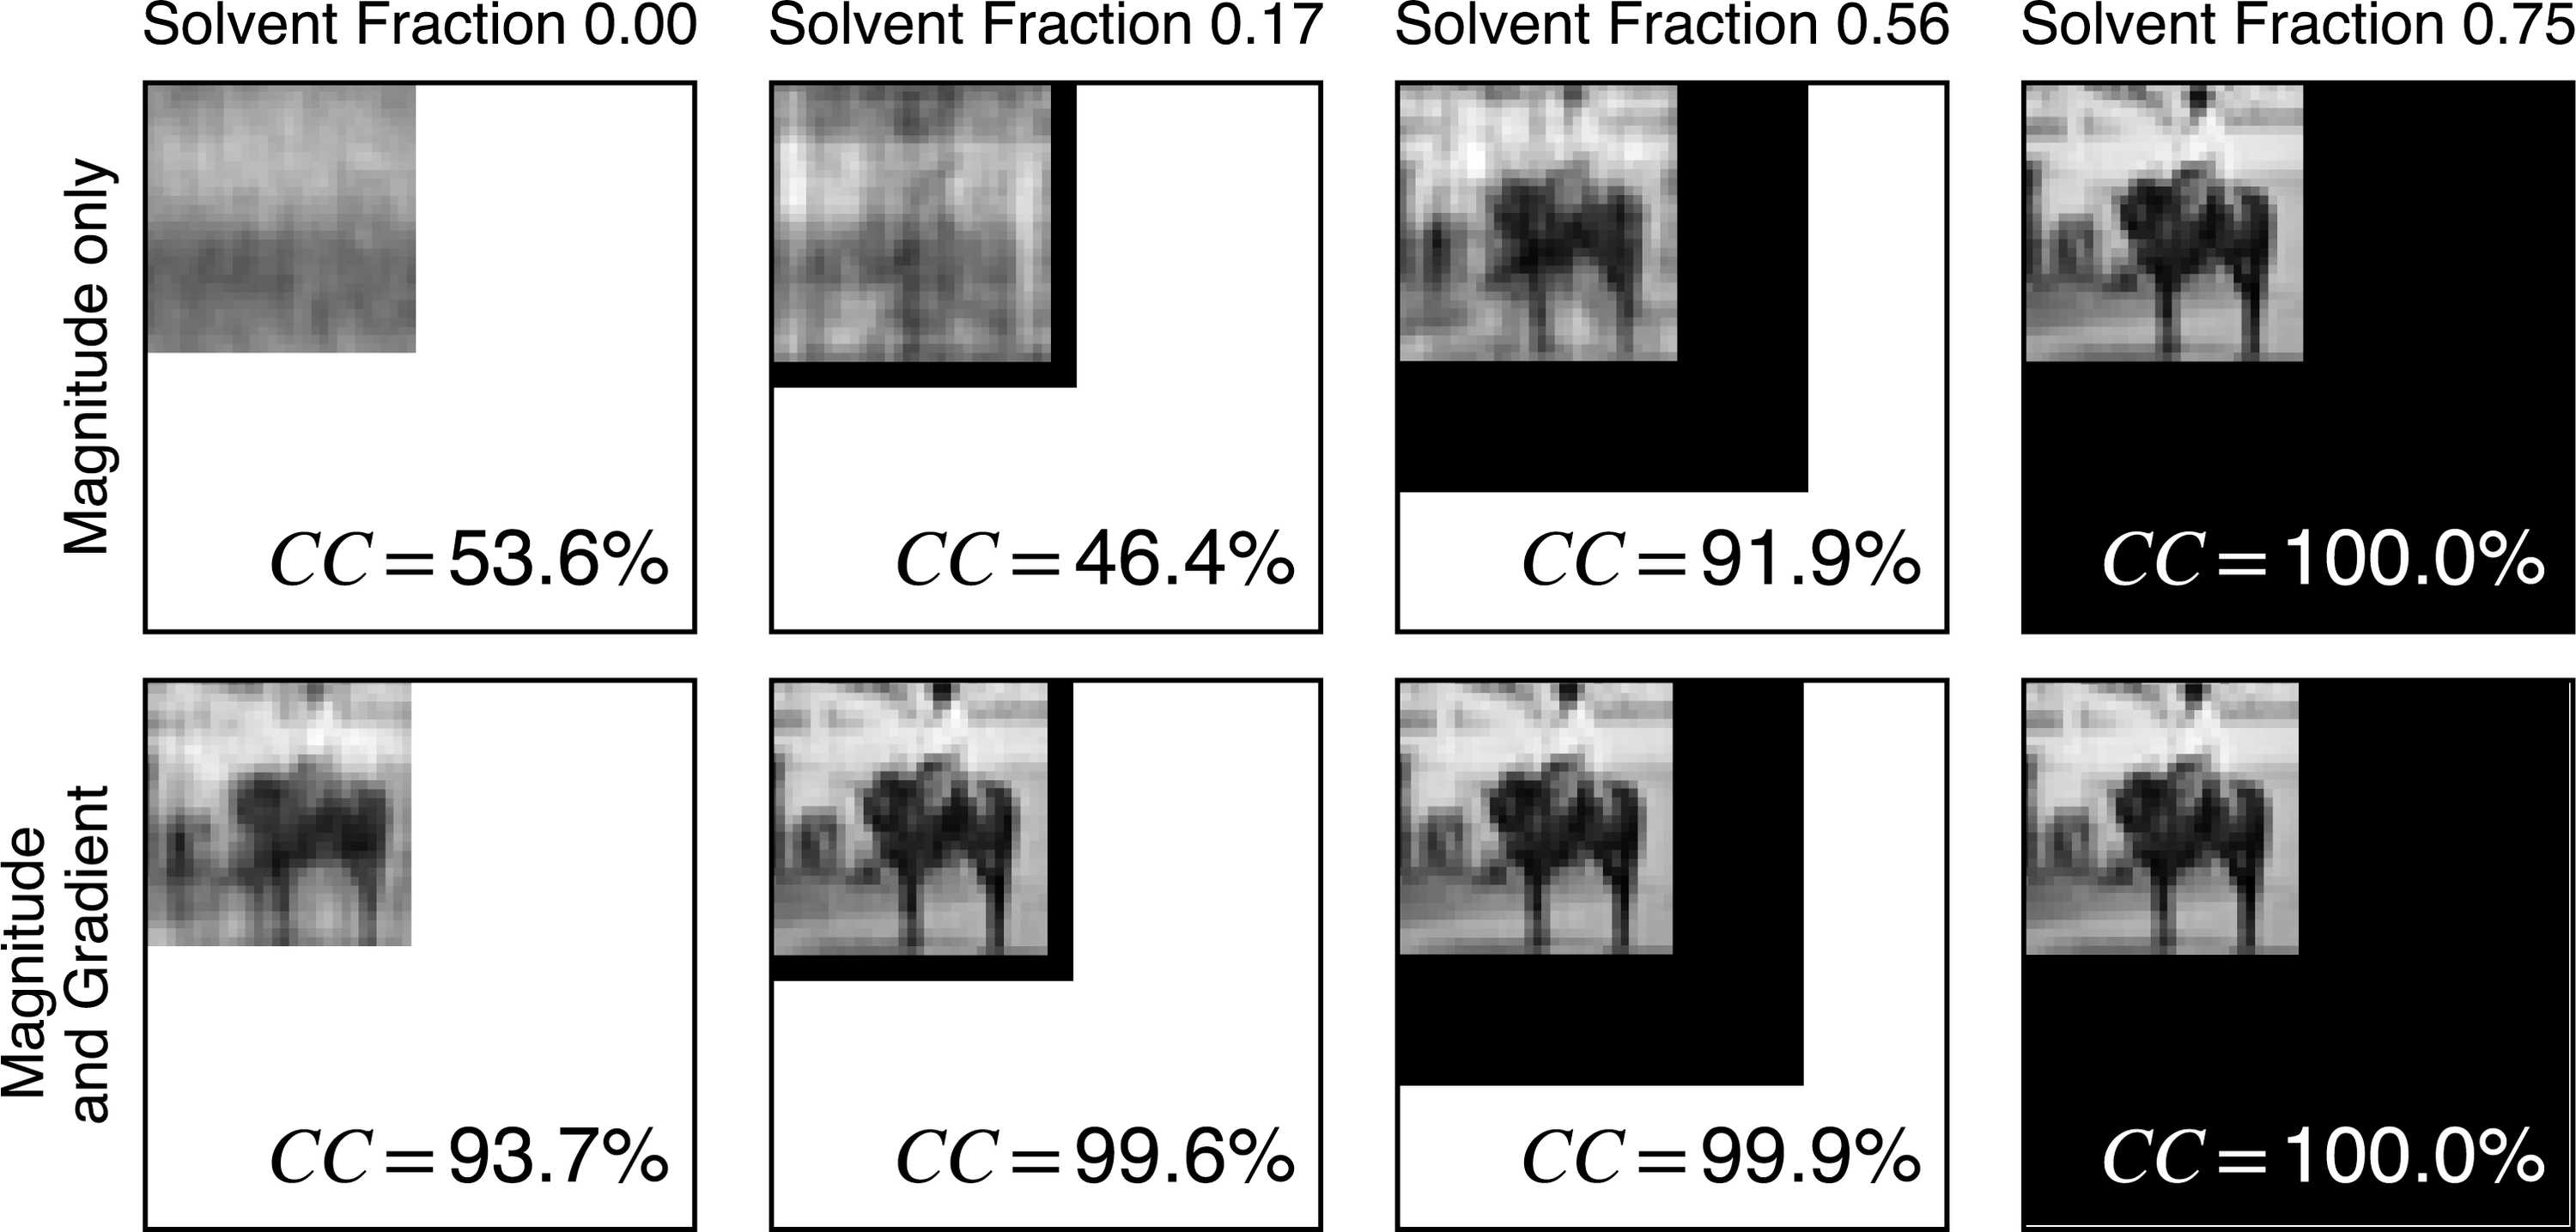
Figure 5
Visual comparison of magnitude-only reconstruction and magnitude-and-gradient reconstruction at different solvent fractions, where the black background indicates the simulated solvent. We display the cross-correlation coefficient (CC) between the reconstruction and the ground truth, excluding the solvent area, in the bottom-right corner. |
 | JOURNAL OF APPLIED CRYSTALLOGRAPHY |
ISSN: 1600-5767
 access