

 menu
|
|
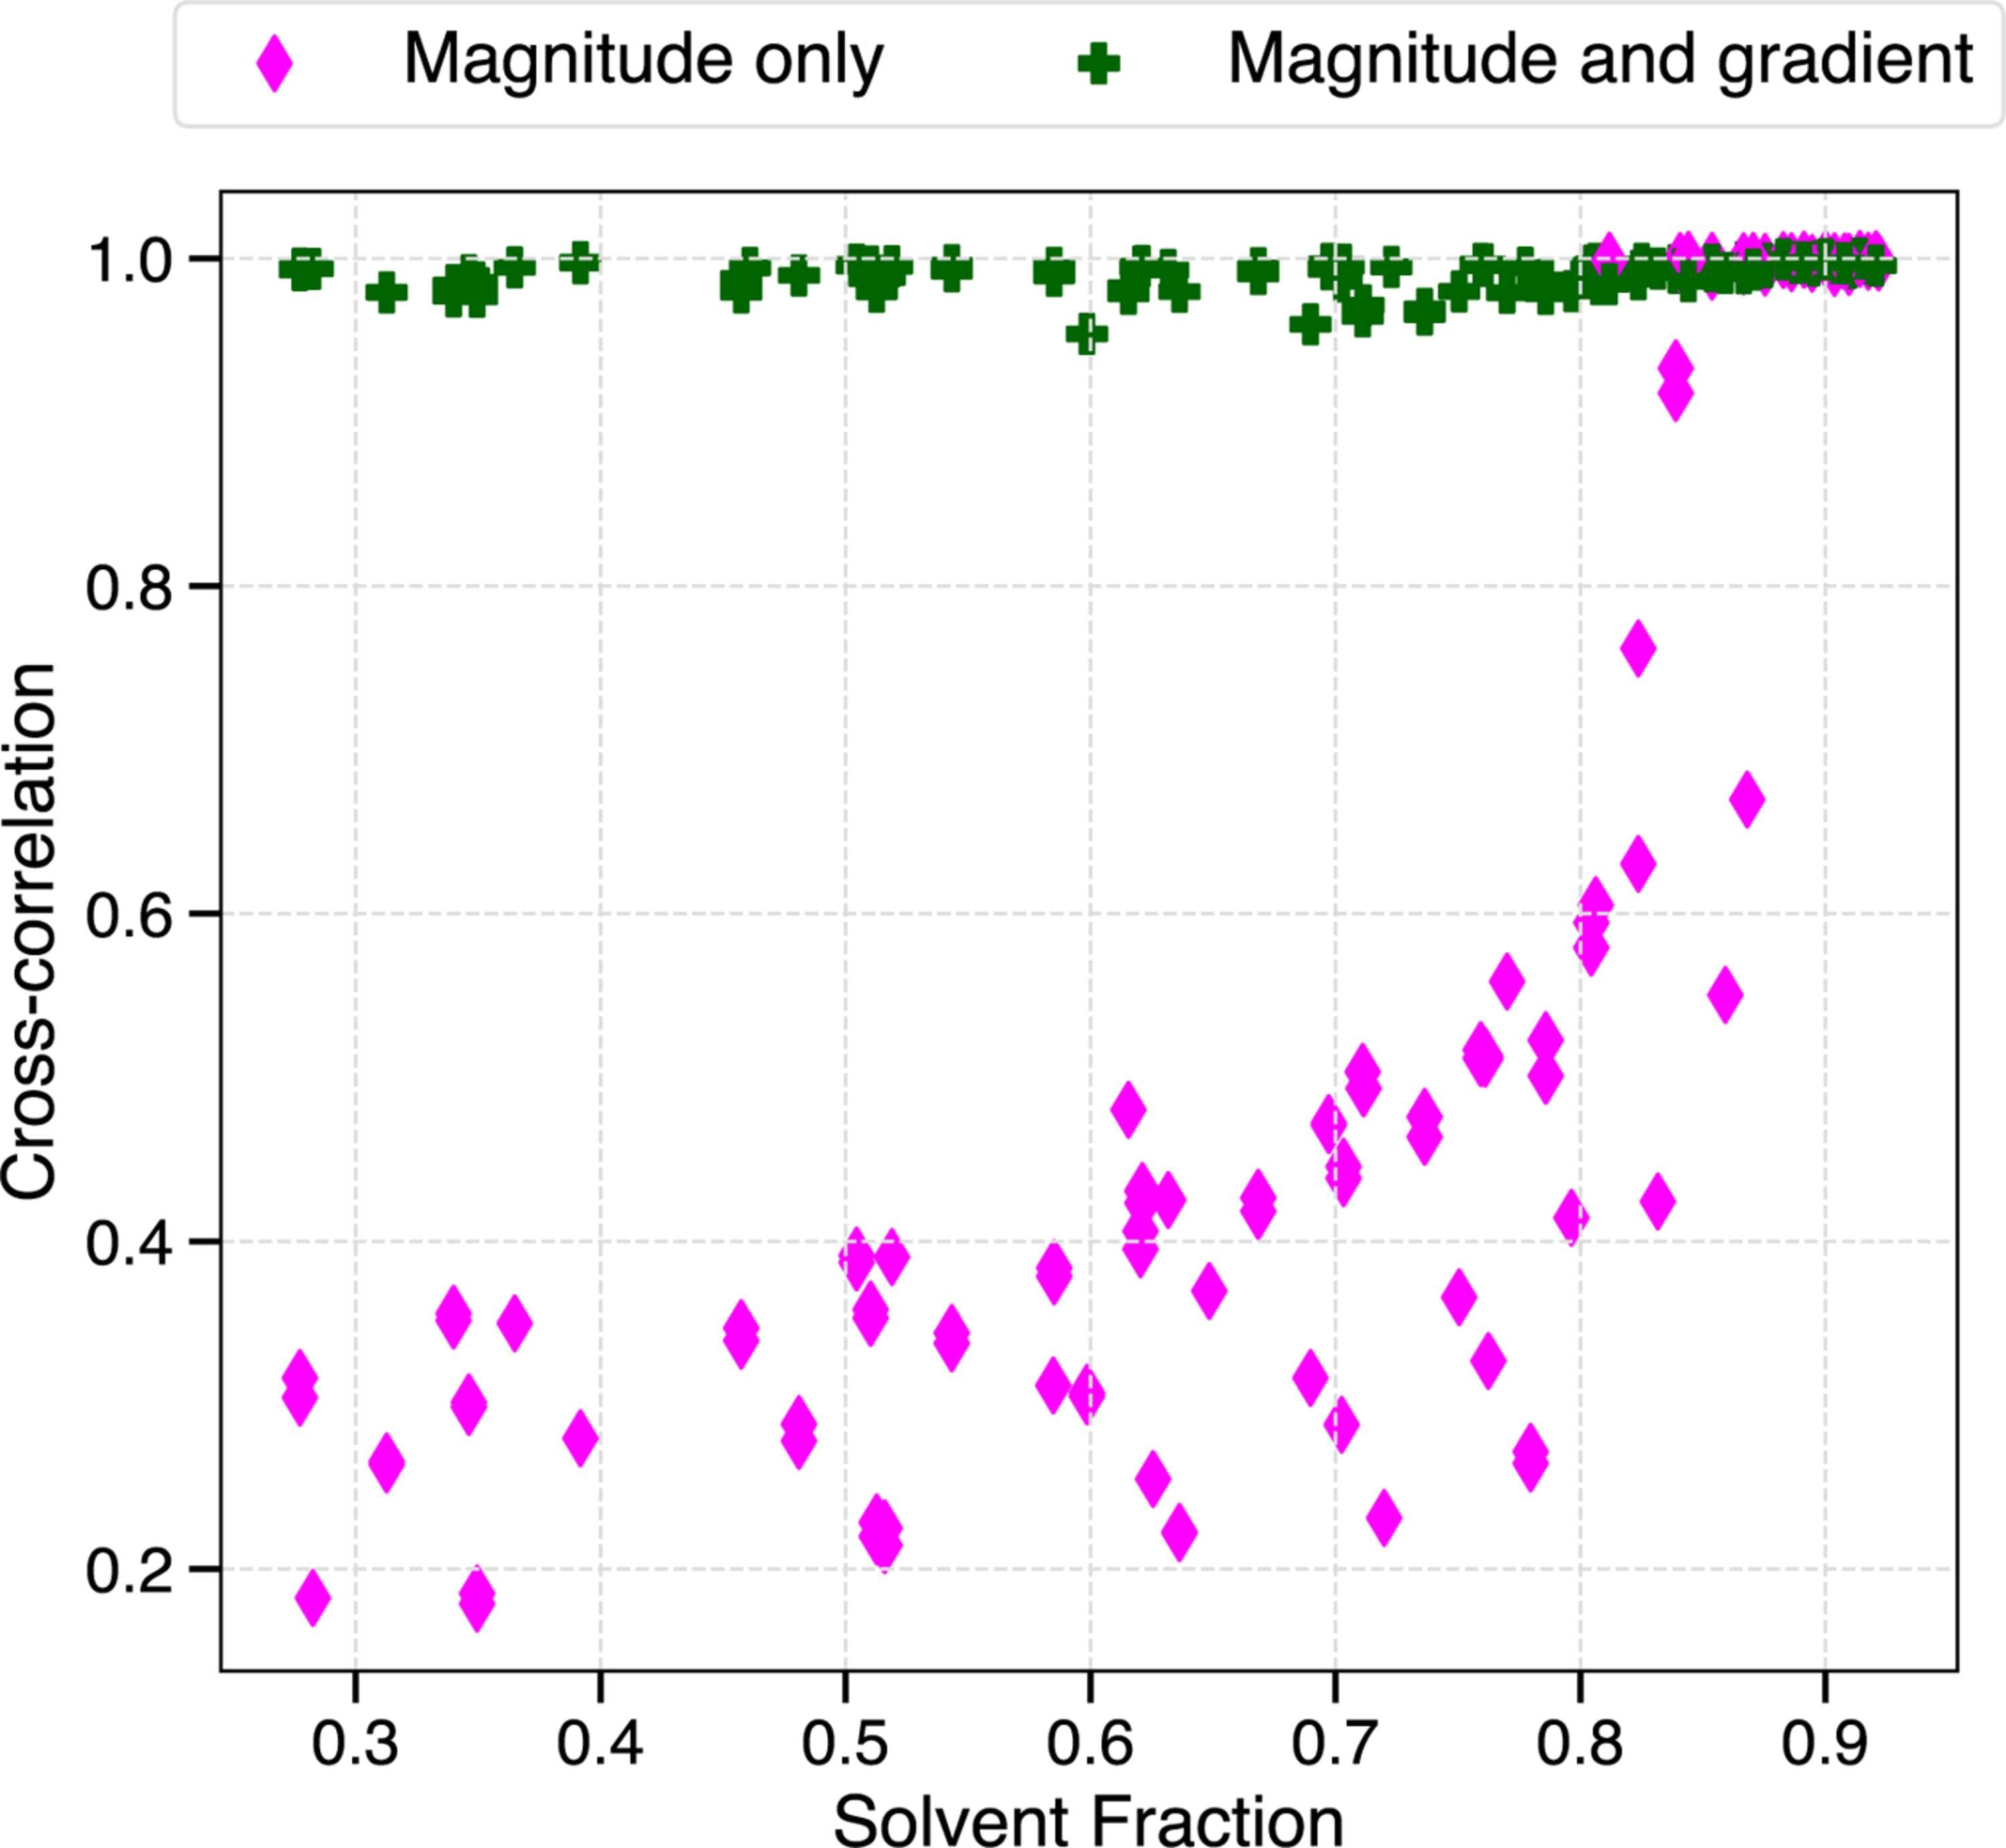
Figure 8
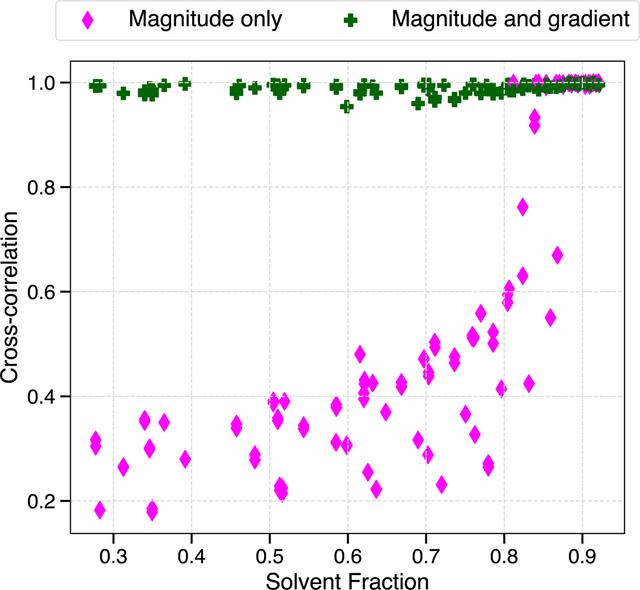
Comparison of magnitude-only and magnitude-and-gradient algorithms at different solvent fractions of both real proteins from the PDB and unit cells with increased solvent fraction. Each data point represents the mean CC of the electron density averaged over 25 runs. |
 | JOURNAL OF APPLIED CRYSTALLOGRAPHY |
ISSN: 1600-5767
 access