

 menu
|
|
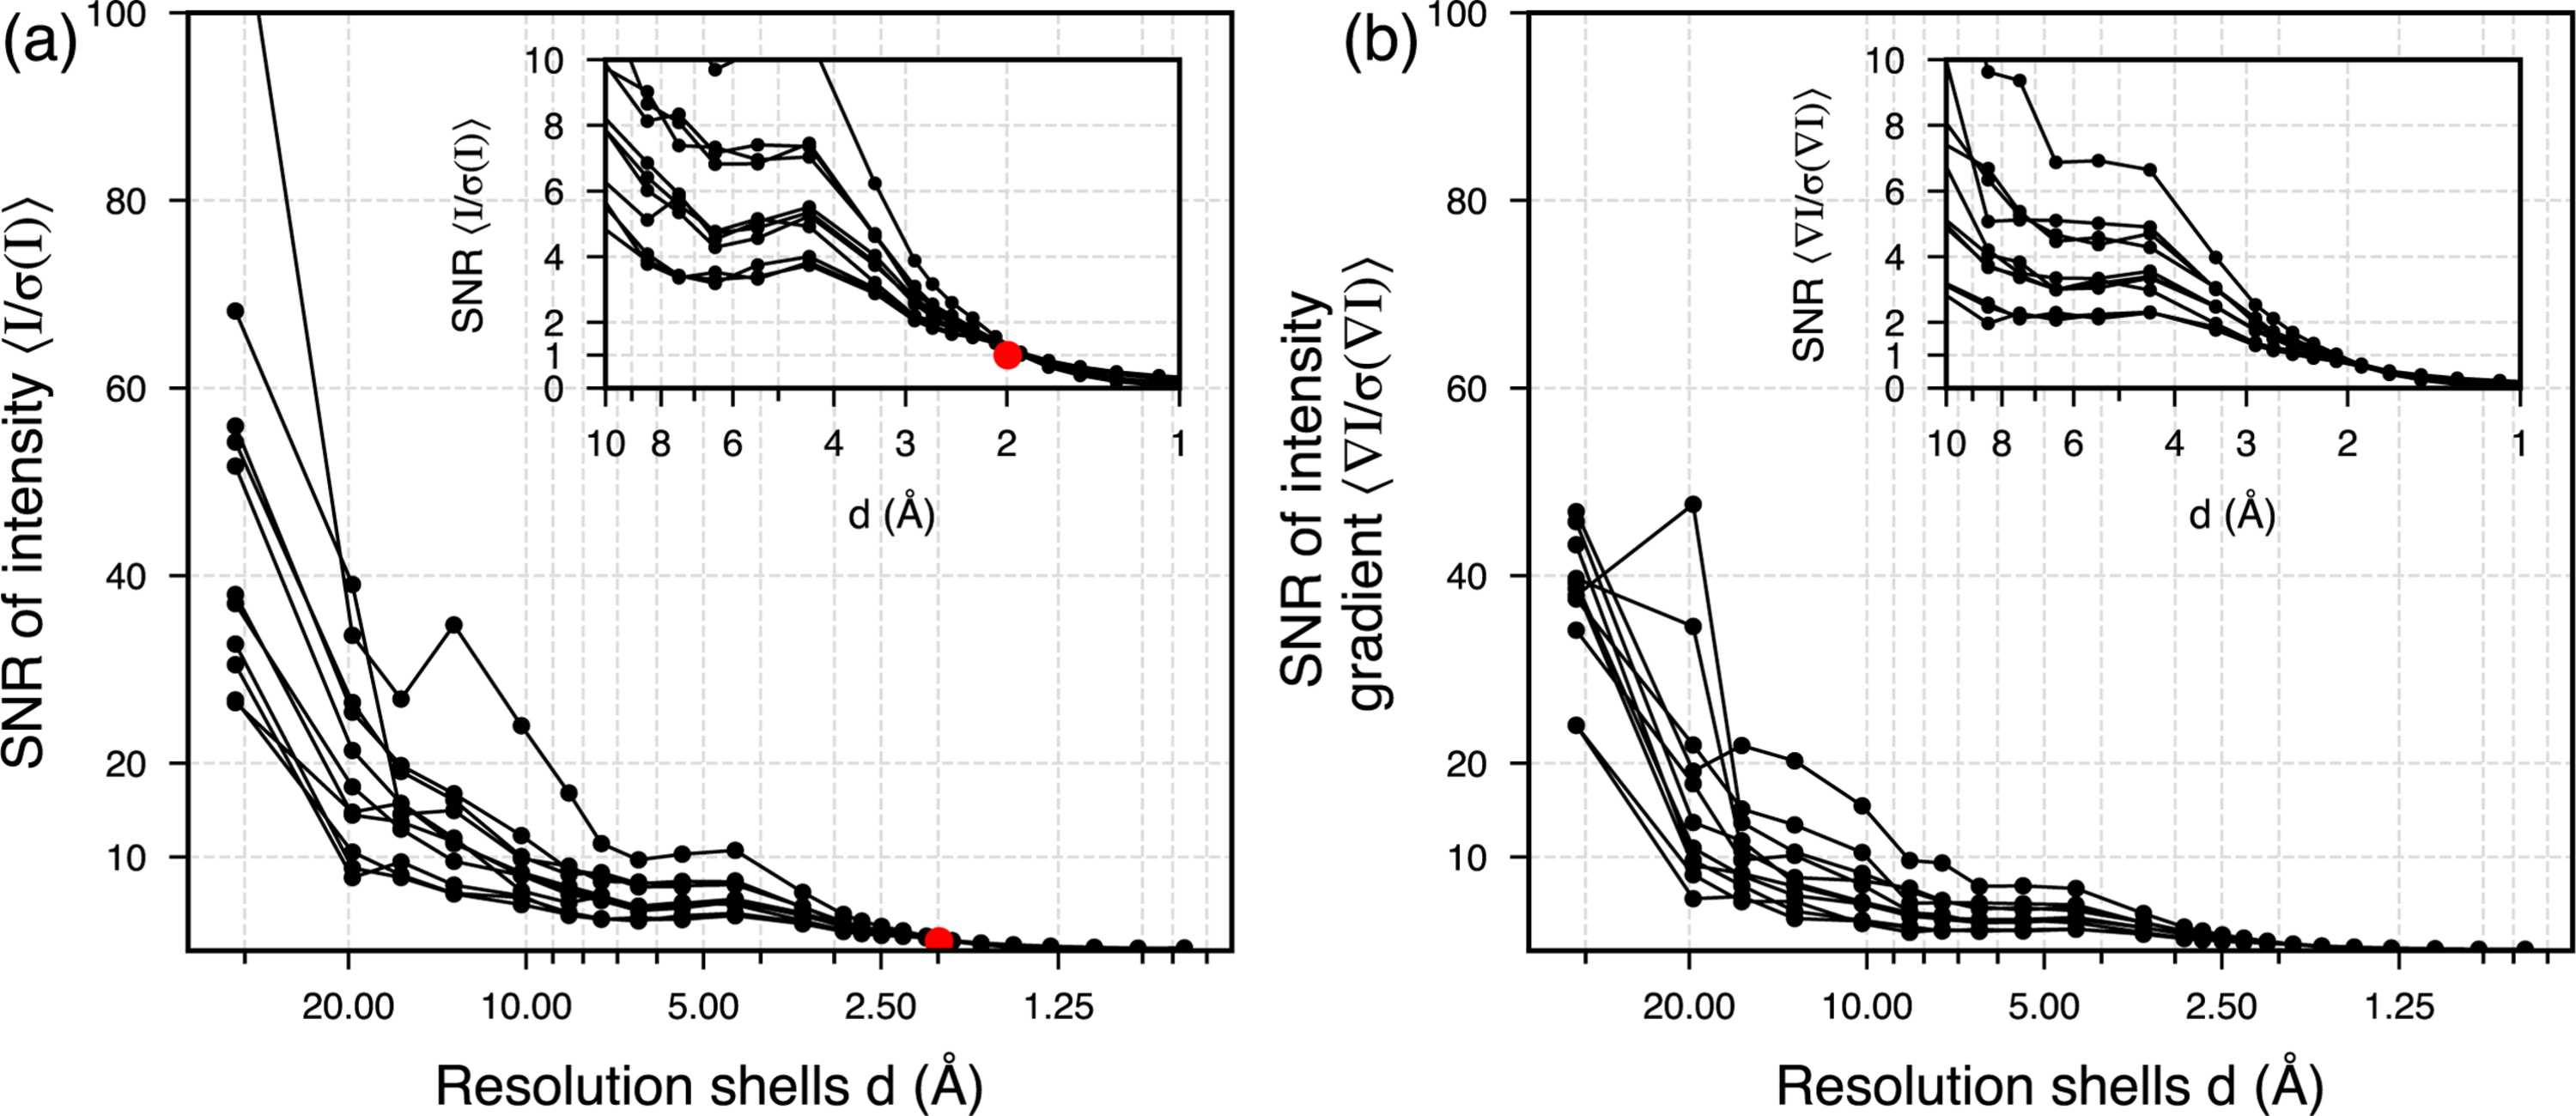
Figure 9
(a) Average SNR at Bragg peaks as a function of resolution, calculated by  where std computes the standard deviation. The red dot is the signal strength indicator η, which normalizes the SNR within the resolution shell  between 1.9 and 2.1 Å – in this case to  . (b) SNR of the molecular gradients, comparing gradients calculated from  and  . The insets give zoomed-in views of the SNR at the Bragg peaks at high resolution. |
 | JOURNAL OF APPLIED CRYSTALLOGRAPHY |
ISSN: 1600-5767
 access