

 menu
|
|
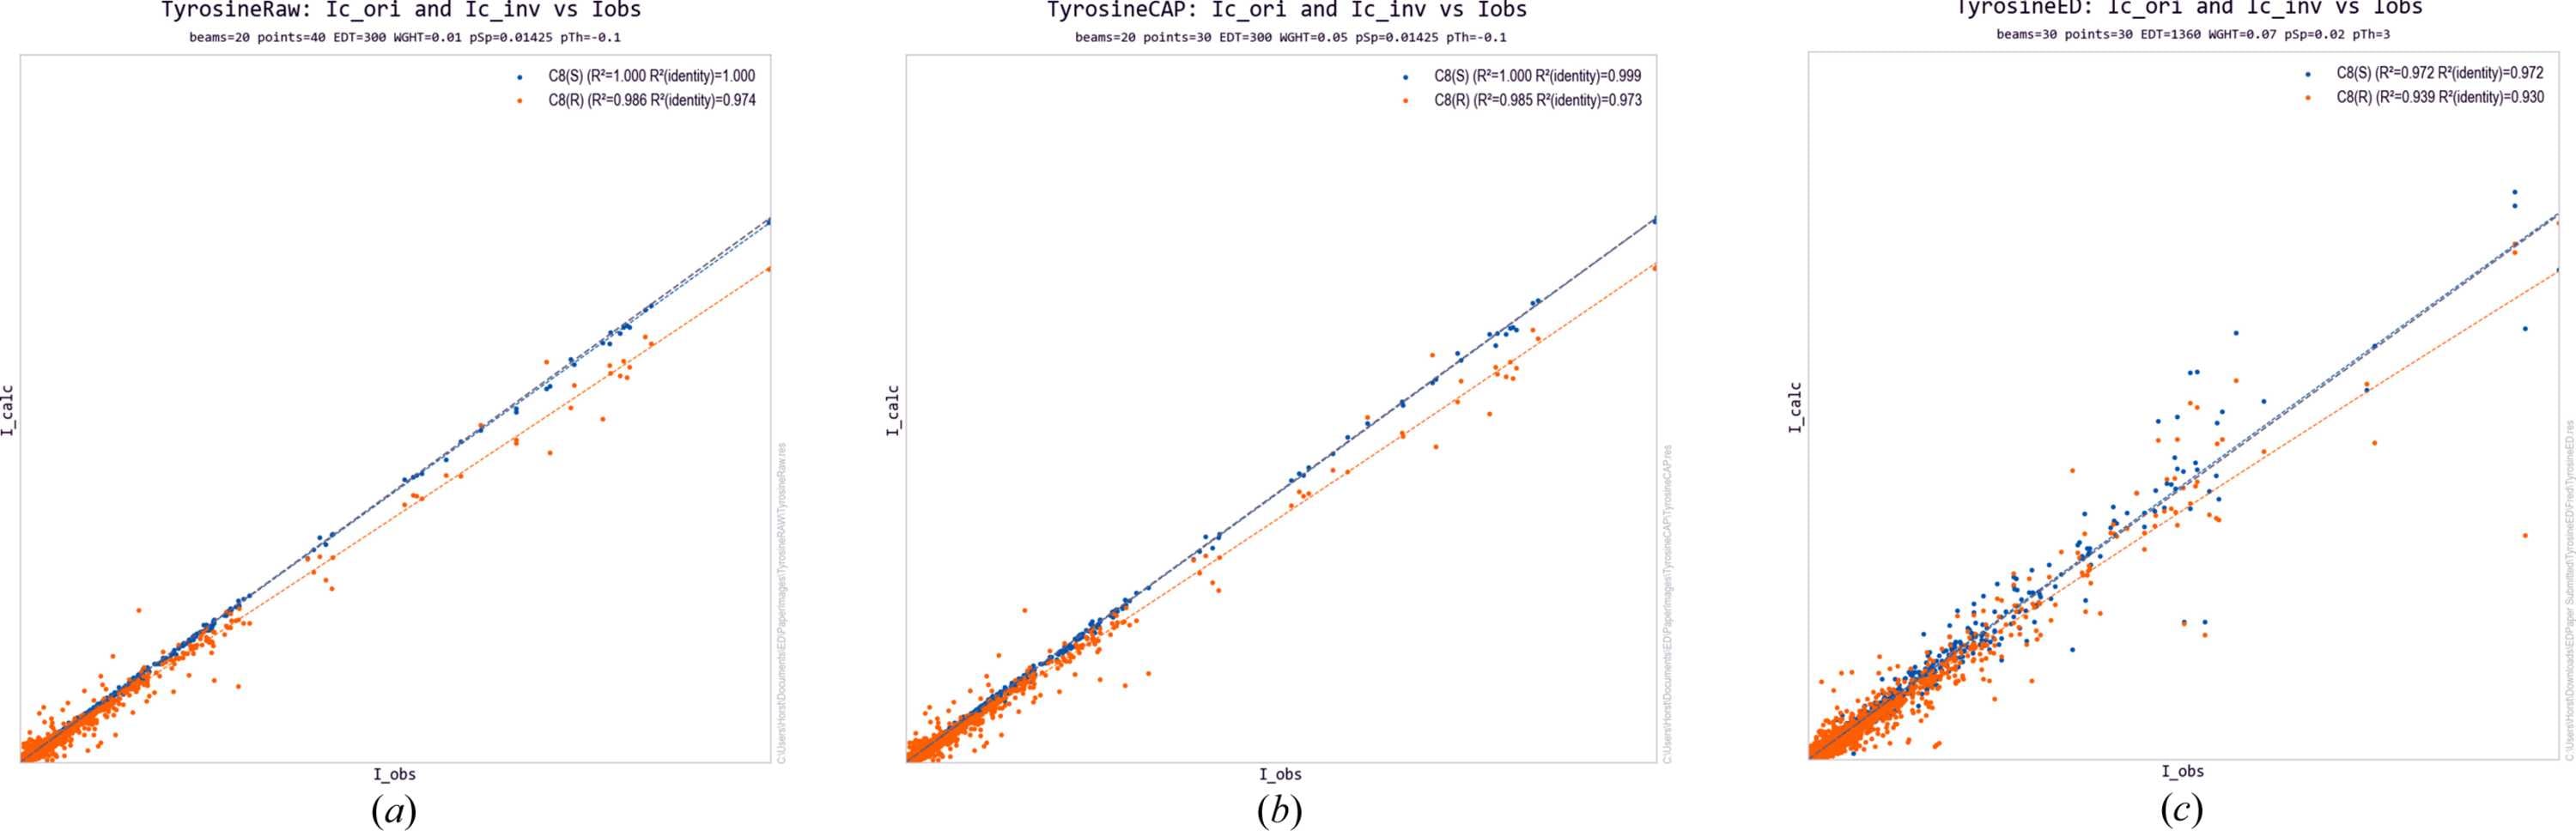
Figure 5
Observed versus calculated intensity plots for the three L-tyrosine test datasets. (a) TyrosineRAW: synthetic data refined against the generating model,  . (b) TyrosineCAP: synthetic data processed through CrysAlisPro integration,  . (c) TyrosineED: real experimental data,  after dynamical refinement (IAM). |
 | JOURNAL OF APPLIED CRYSTALLOGRAPHY |
ISSN: 1600-5767
 access