


 menu
|
|
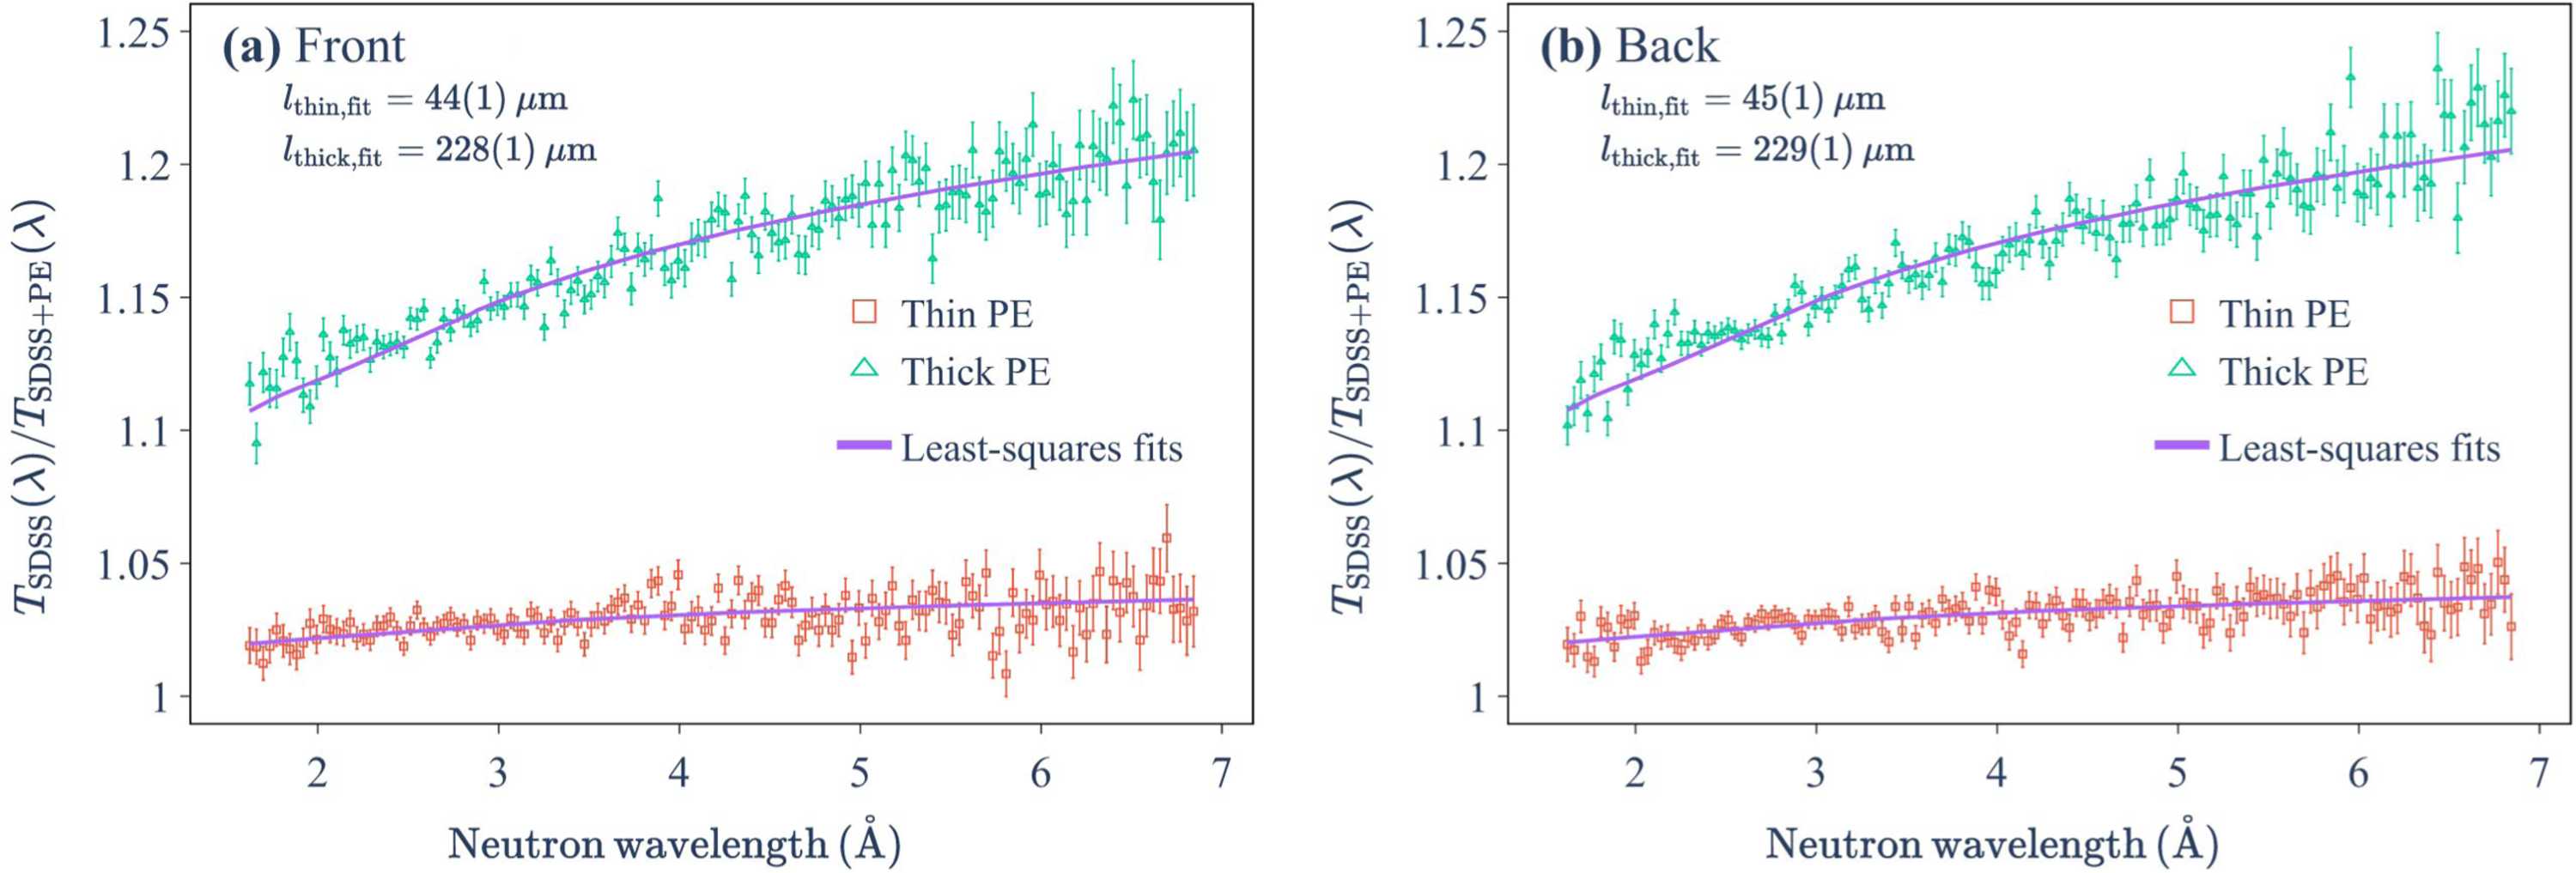
Figure 10
Experimental (markers) and fitted (lines) neutron transmission spectra ratios for the SDSS sample measured on IMAT: (a) front and (b) back measurements. The NCrystal-based least-squares fits quantitatively reproduce this attenuation trend, yielding PE thicknesses with 1 µm uncertainty, as listed. See text for further discussion. |
IUCrJ
ISSN: 2052-2525
NEUTRON | SYNCHROTRON
Open  access