


 menu
|
|
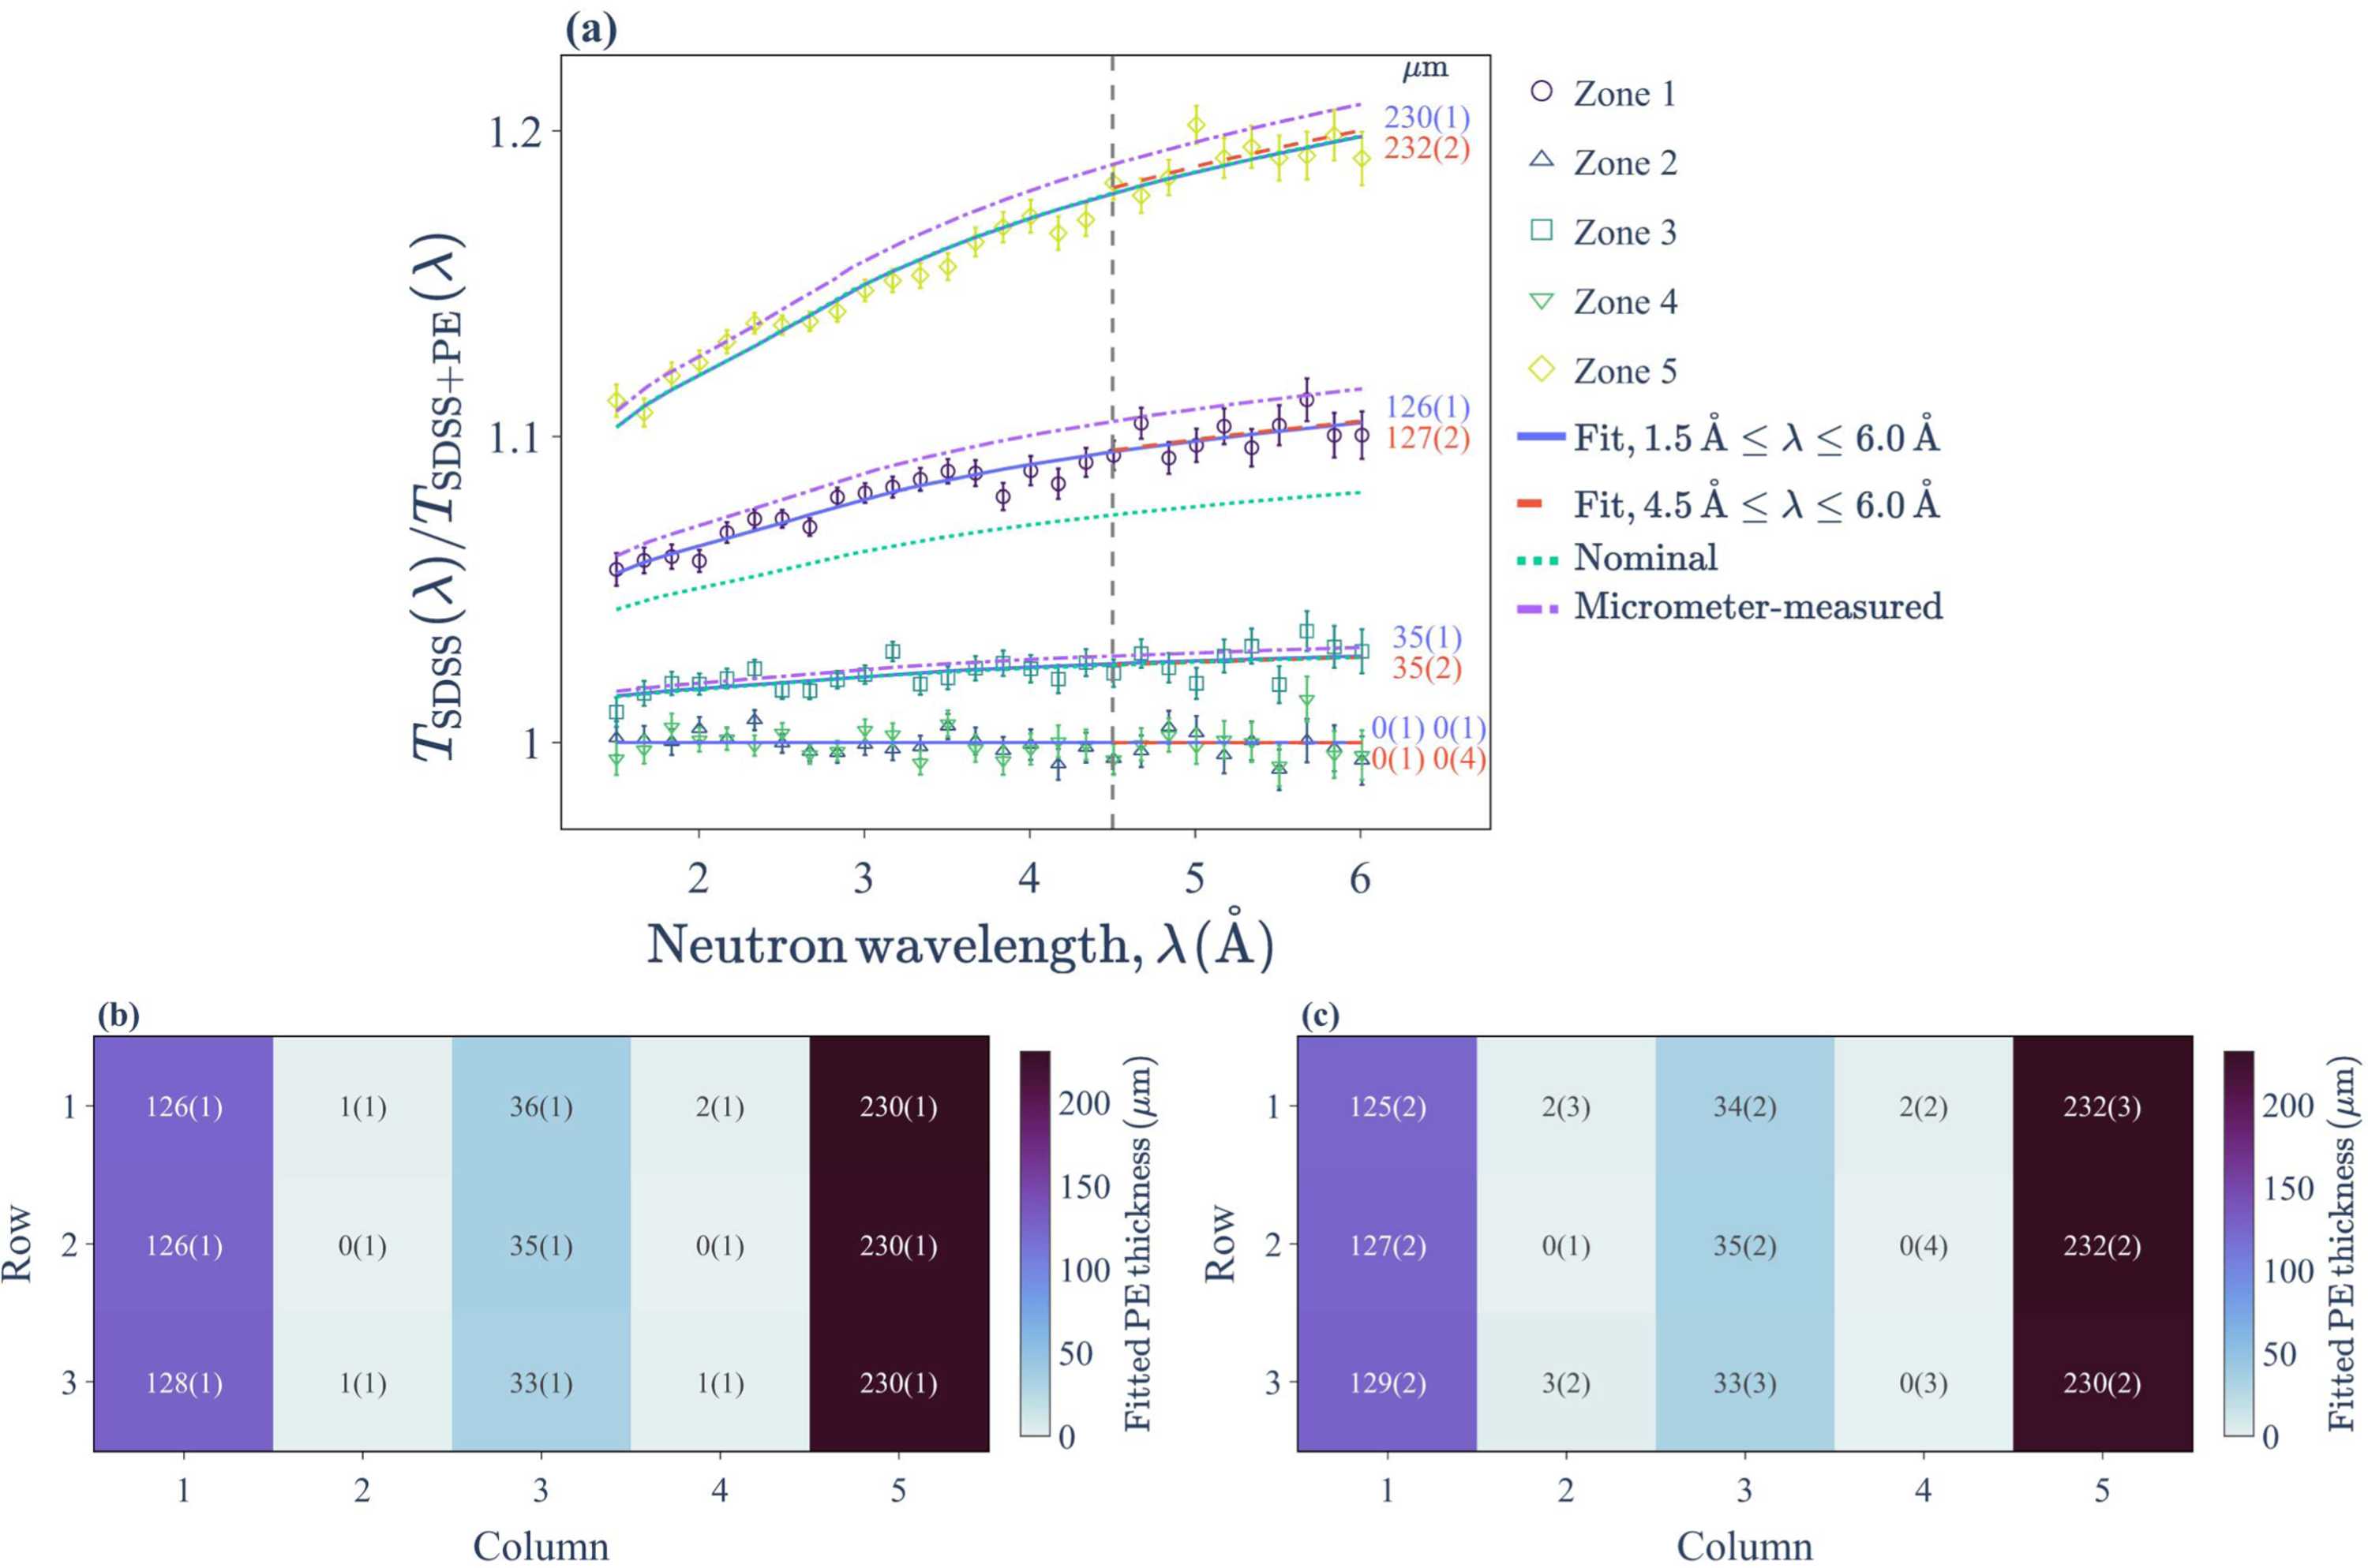
Figure 11
(a) Experimental and fitted neutron transmission spectra ratios for Zones 1–5. Experimental data (binned for clarity) are shown alongside fits over the full wavelength range (1.5–6.0 Å, solid lines) and after the Bragg cutoff (4.5–6.0 Å, dashed lines). Inset values indicate the corresponding fitted PE thicknesses. For comparison, the transmission ratios calculated using nominal (dotted lines) and micrometer-measured (dashed–dotted lines) PE thicknesses are also shown. (b) and (c) Two-dimensional fitted PE thickness maps for the wavelength ranges of 1.5–6.0 Å and 4.5–6.0 Å, respectively. See text for further discussion. |
IUCrJ
ISSN: 2052-2525
NEUTRON | SYNCHROTRON
Open  access