


 menu
|
|
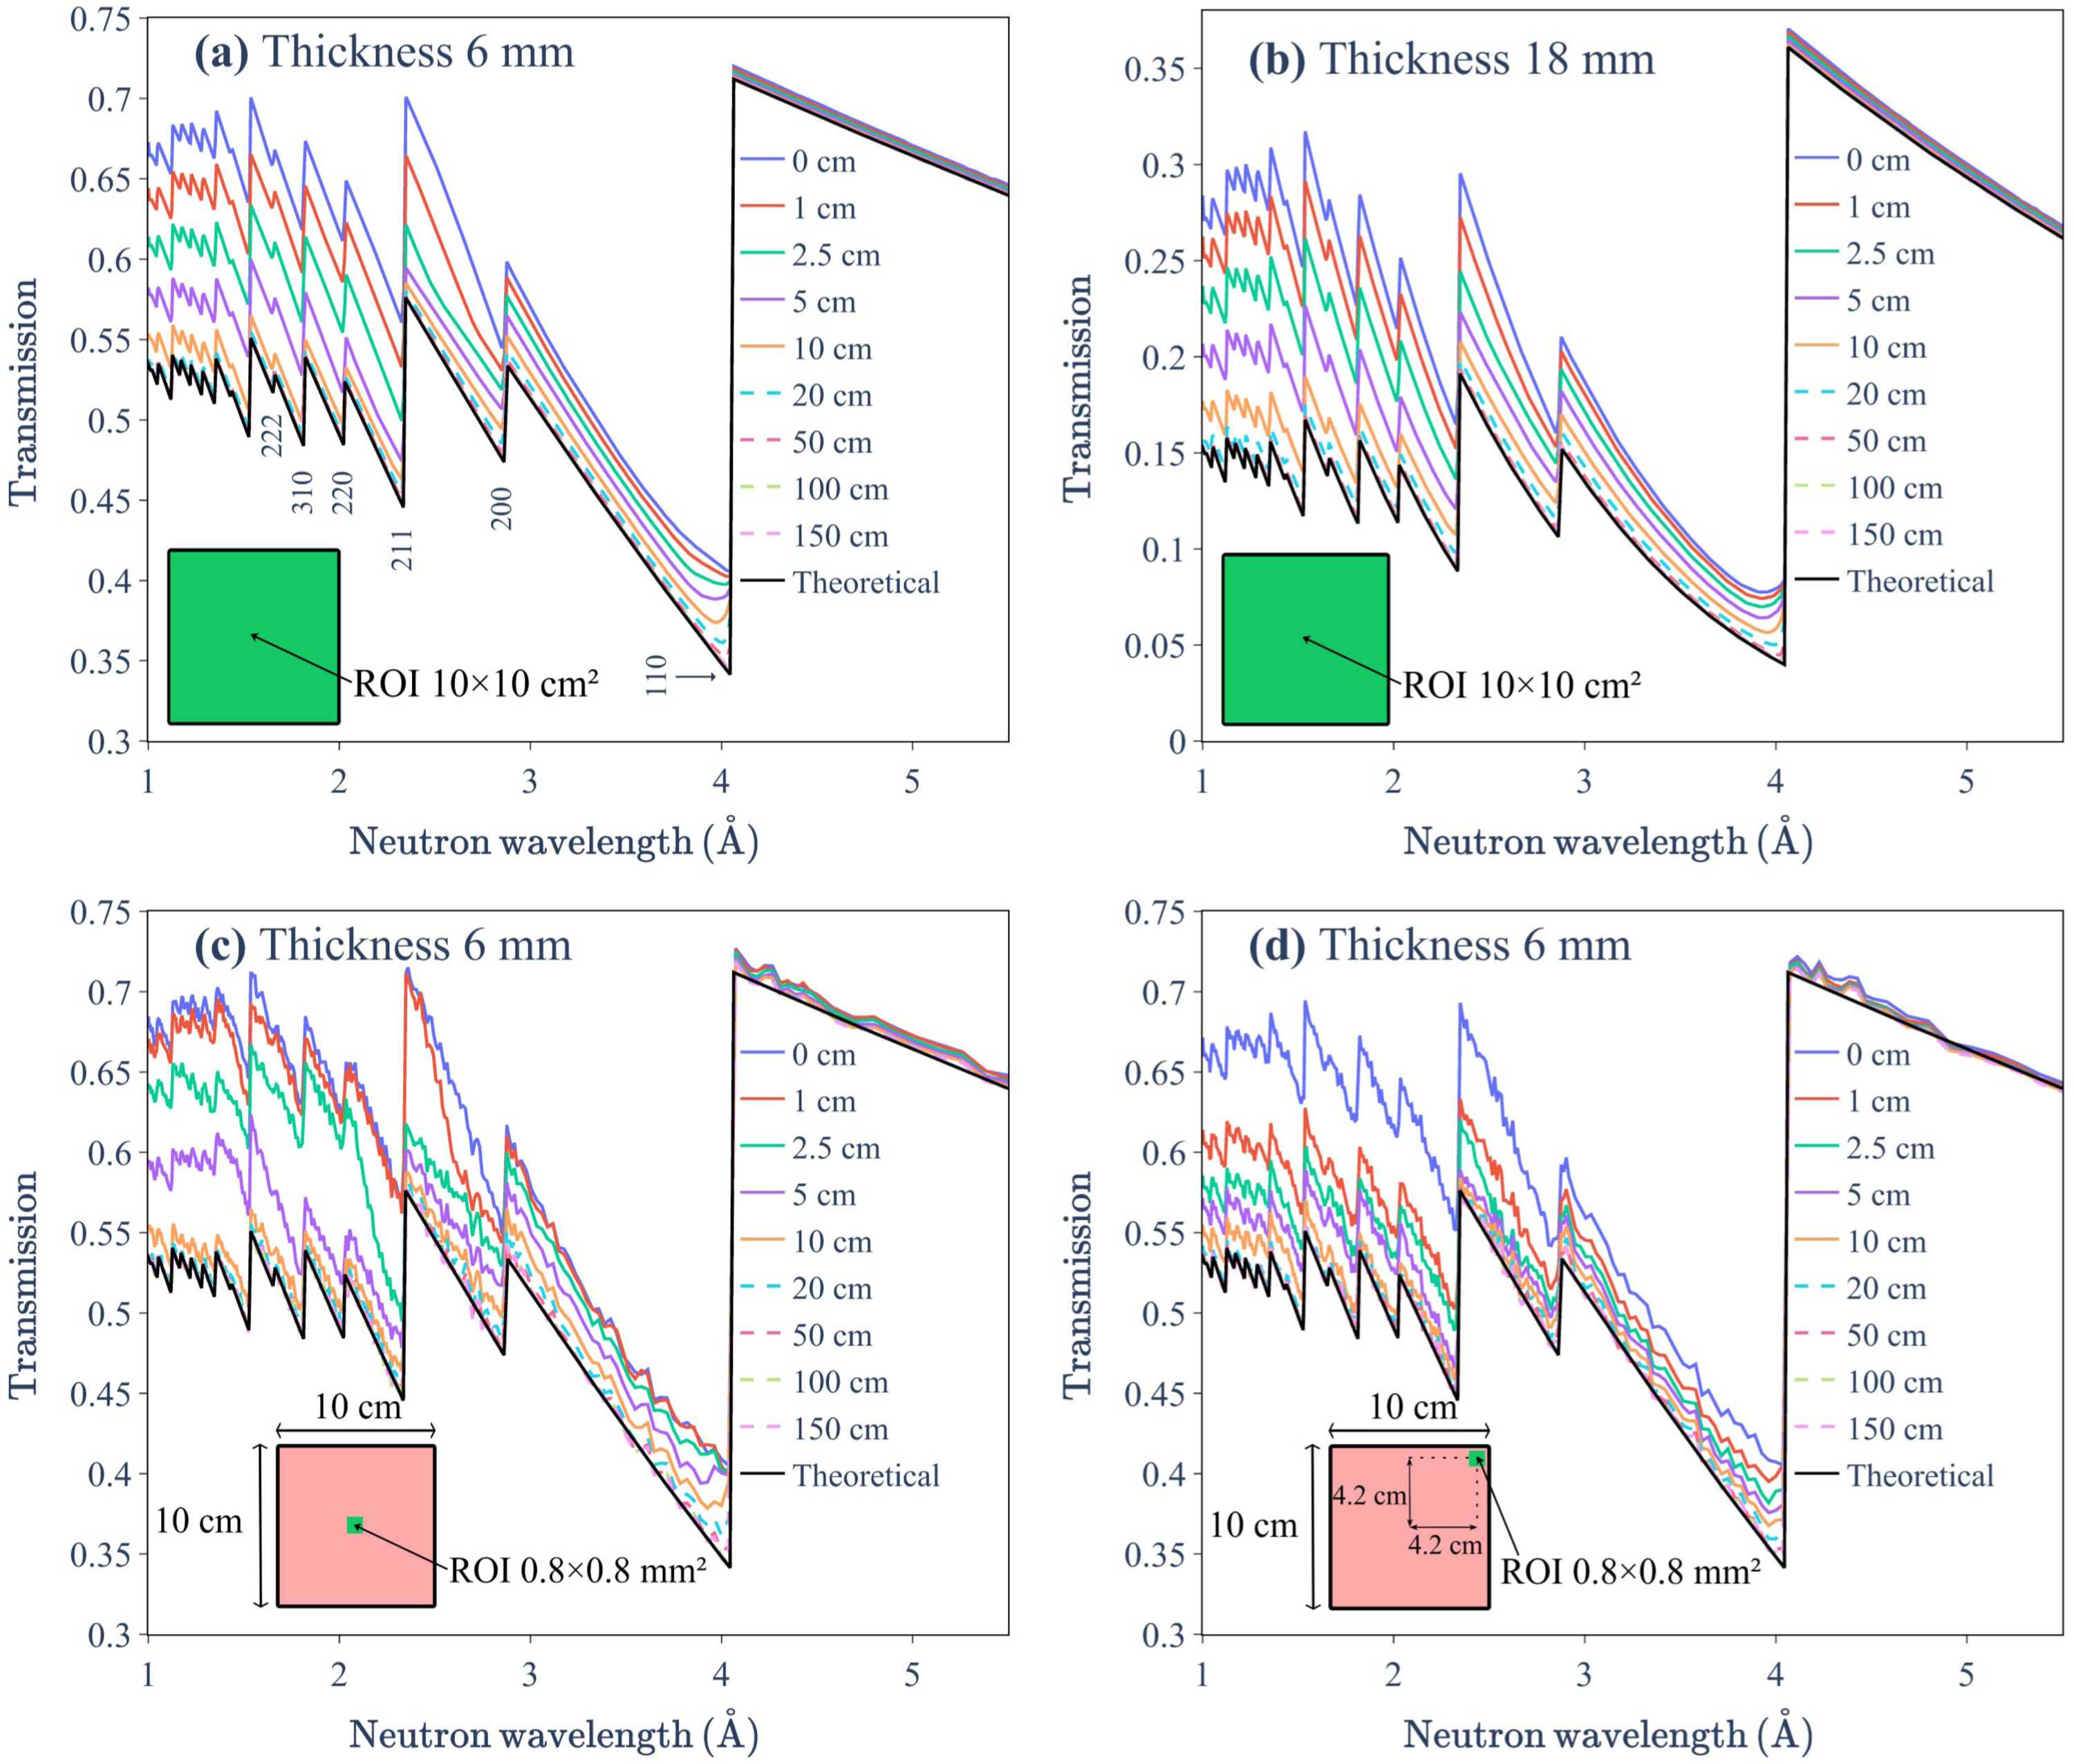
Figure 12
OpenMC+NCrystal simulated transmission spectra for a b.c.c. iron plate illuminated by a 10 × 10 cm parallel neutron beam. The setup replicates the configurations presented by Sato et al. (2017  ). Spectra are shown for a TOF detector positioned at various distances downstream from the sample; theoretical predictions are indicated by solid black lines. Iron plate thicknesses and the sizes and positions of the ROIs are specified in each panel. The results in panels (a), (c) and (d) are in good agreement with Figs. 2, 5 and 6, respectively, in the work of Sato et al. (2017), validating our OpenMC+NCrystal simulation framework. |
IUCrJ
ISSN: 2052-2525
NEUTRON | SYNCHROTRON
Open  access