


 menu
|
|
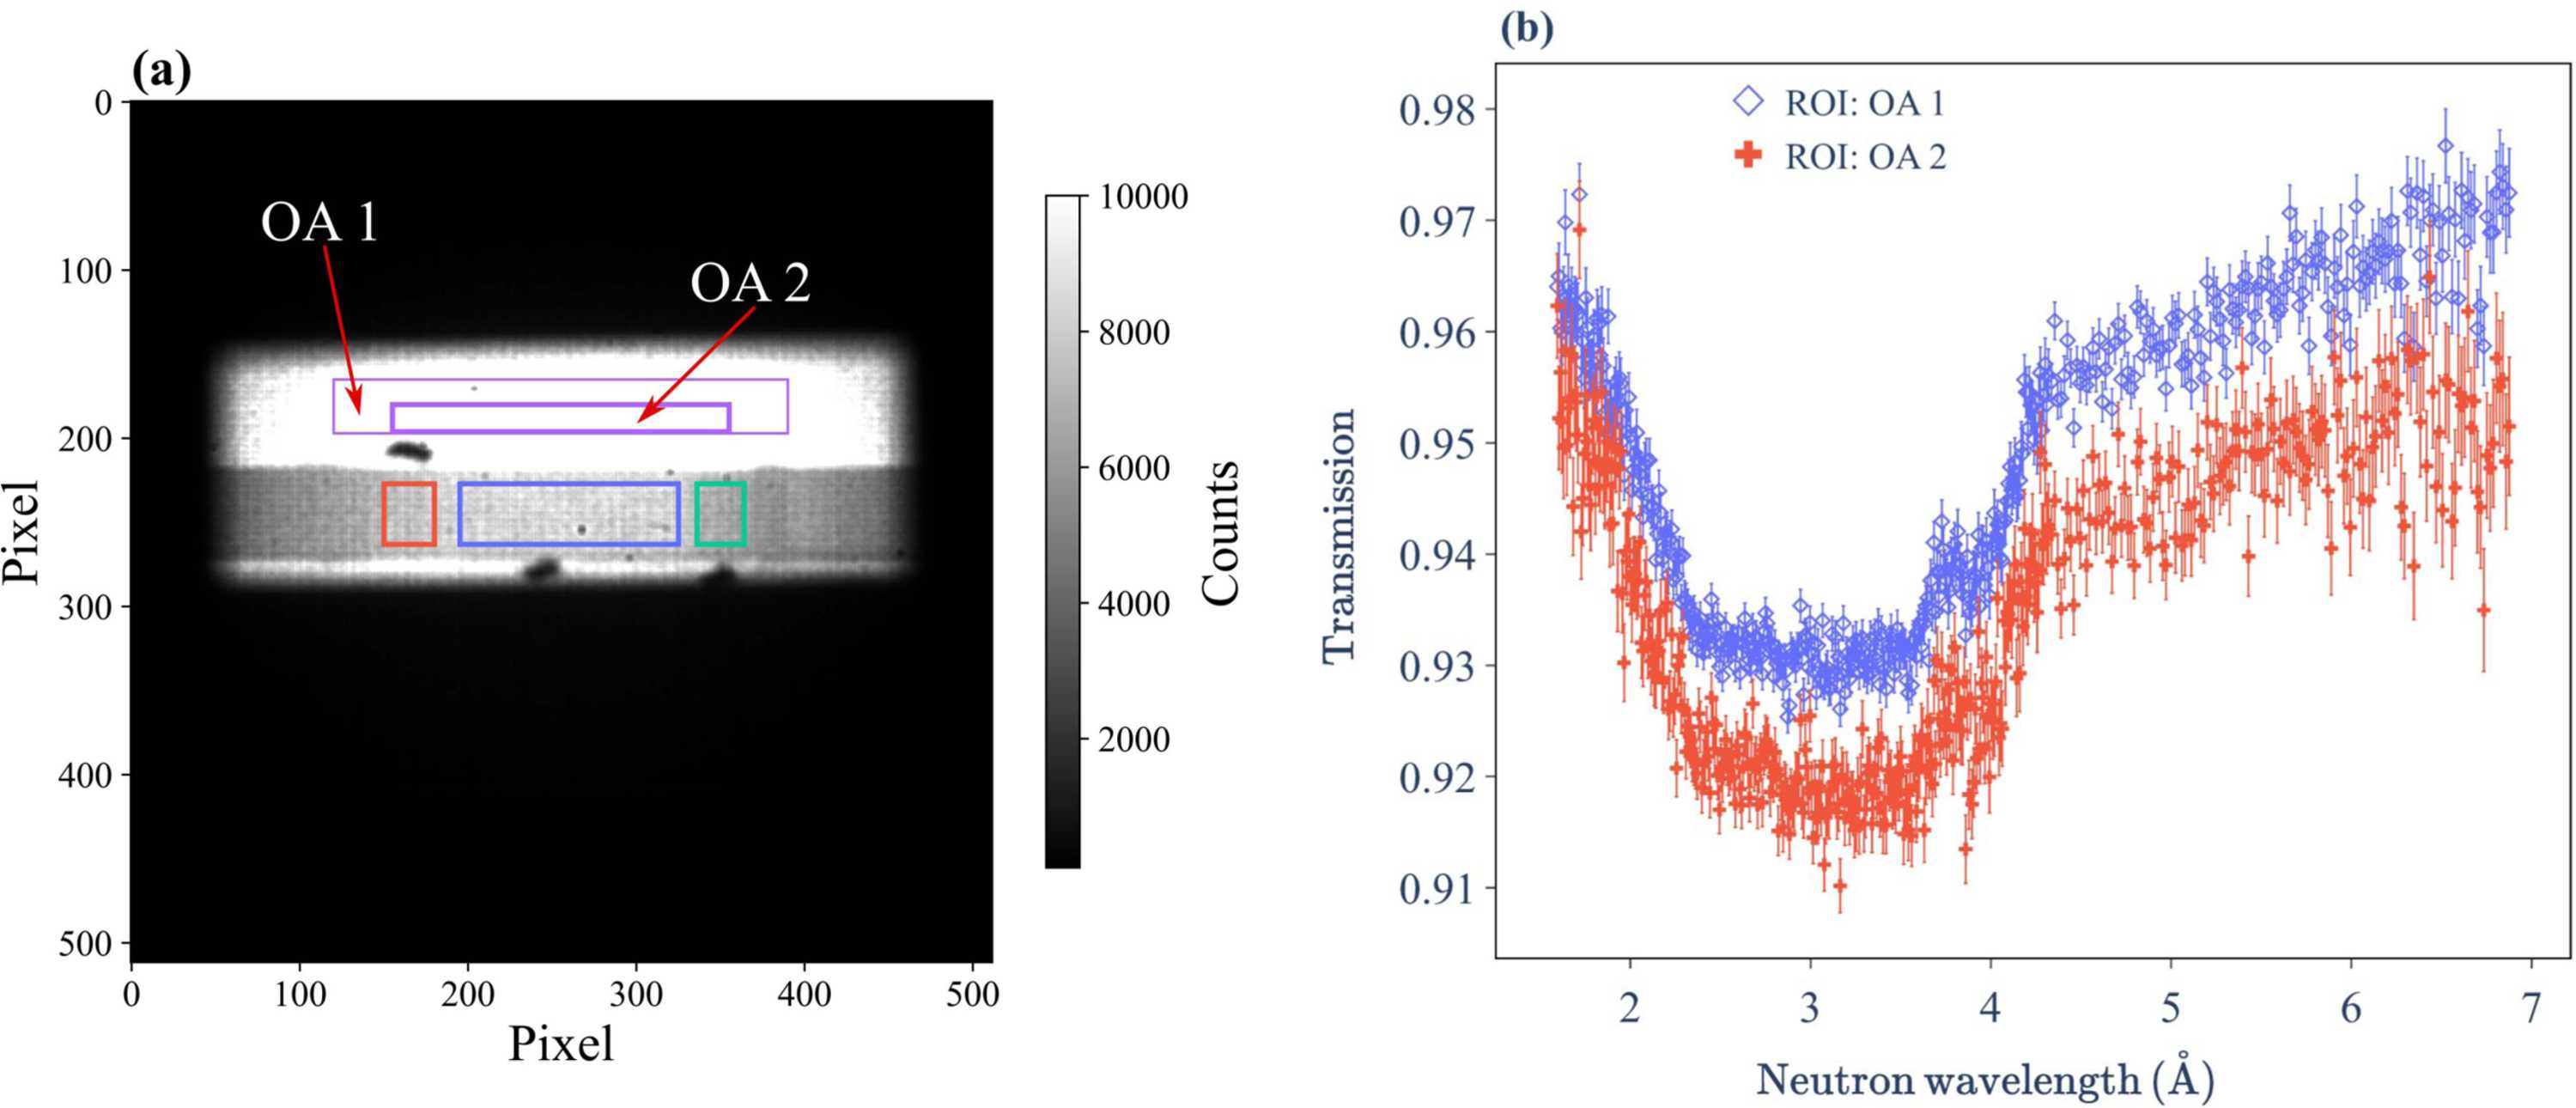
Figure 16
(a) Radiograph measured for the front configurations measured on IMAT. Two ROIs within the OA regions are indicated, denoted OA1 and OA2. (b) Corresponding wavelength-resolved neutron transmission spectra for OA1 and OA2. The spectrum of OA1 is identical to that shown in the upper plot of Fig. 6(c). |
IUCrJ
ISSN: 2052-2525
NEUTRON | SYNCHROTRON
Open  access