


 menu
|
|
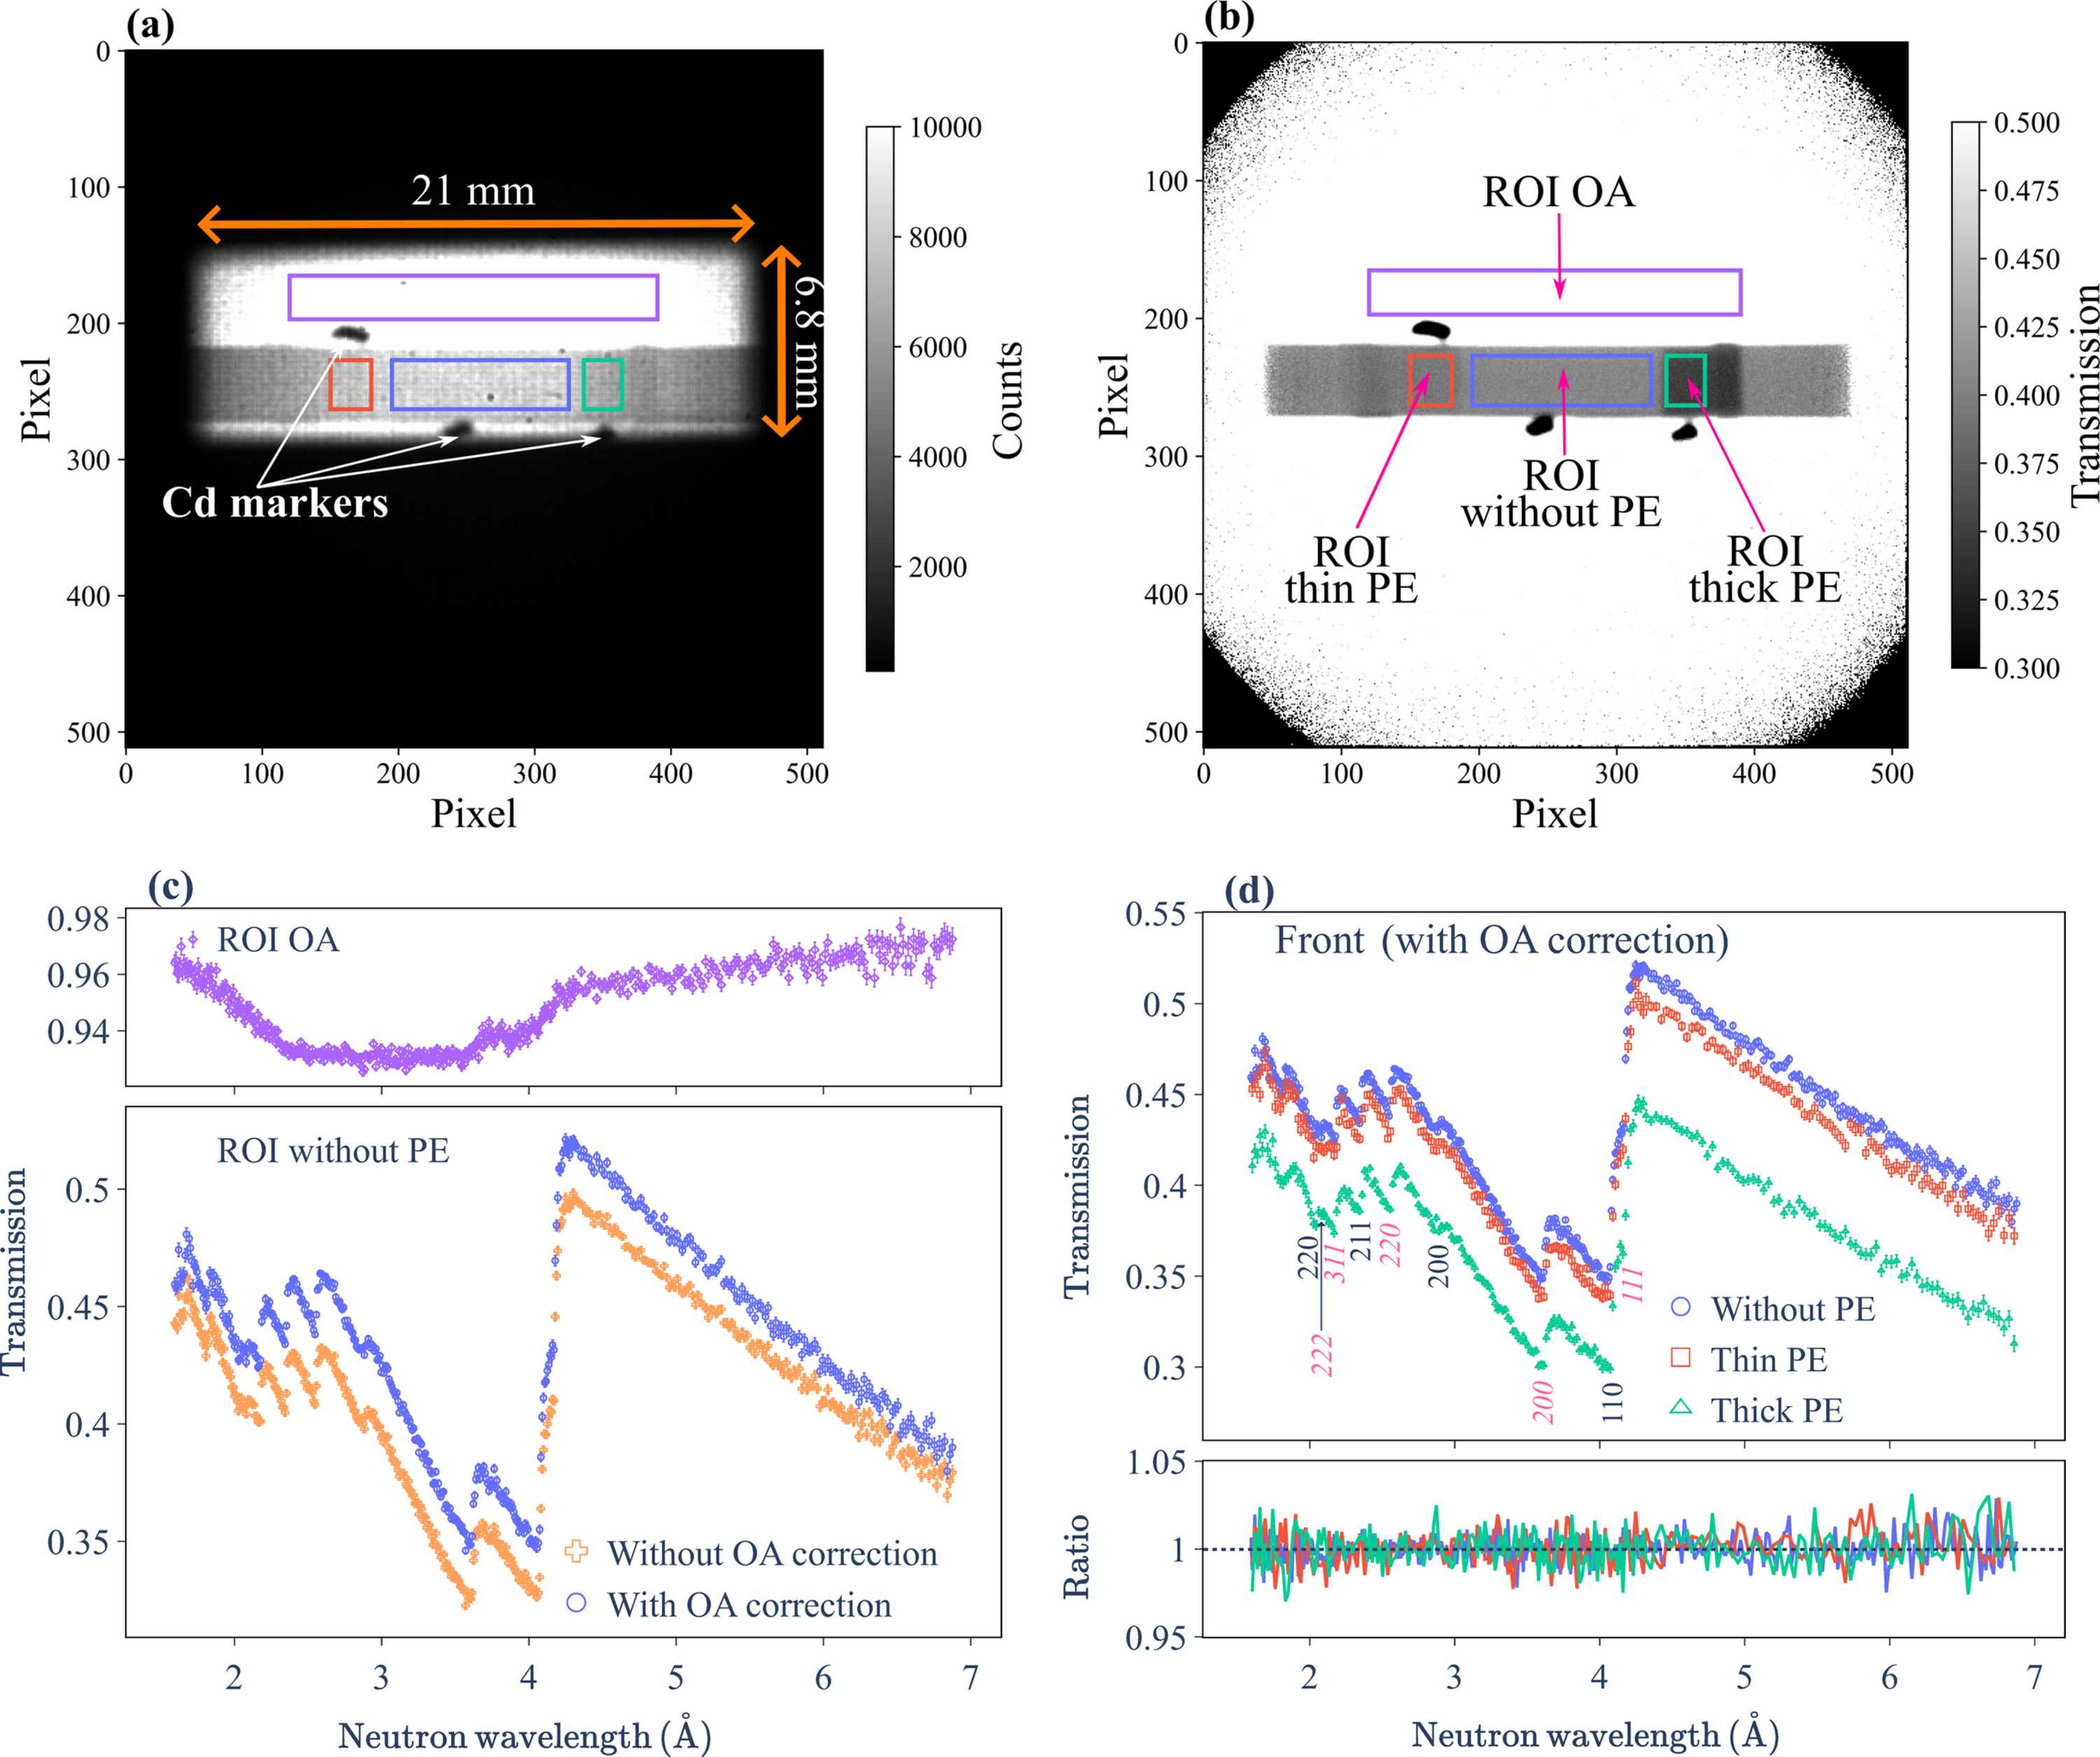
Figure 6
(a) Integrated neutron radiograph of the front SDSS sample configuration, summed over the wavelength range of 1.6–7.0 Å. The 21 × 6.8 mm rectangular beam profile, the sample and three cadmium markers are clearly visible within the 512 × 512 pixel detection area. (b) Normalized transmission image obtained by dividing the image in panel (a) by the open-beam reference (integrated over the same wavelength range) with proton-charge normalization. Four ROIs [coloured red, blue, green and purple, also indicated in (a)] were defined based on cadmium marker positions: thin PE attachment (left), without PE attachments (bottom centre), with thick PE attachment (right) and OA (top centre). (c) Front neutron transmission spectra for the OA (top panel) and the PE-free SDSS ROI (lower panel). The OA correction compensates for the wavelength-dependent offset observed in the OA transmission, resulting in a non-negligible upward shift of the transmission spectrum. (d) Transmission spectra for all ROIs after OA correction. Primary hkl reflections for both the ferrite and austenite phases are labelled (austenite indices in italics). Back spectra are omitted due to their overlap with front measurements. The lower panel displays the front-to-back transmission ratios, showing a consistent average ratio of unity across all ROIs. |
IUCrJ
ISSN: 2052-2525
NEUTRON | SYNCHROTRON
Open  access