

 menu
|
|
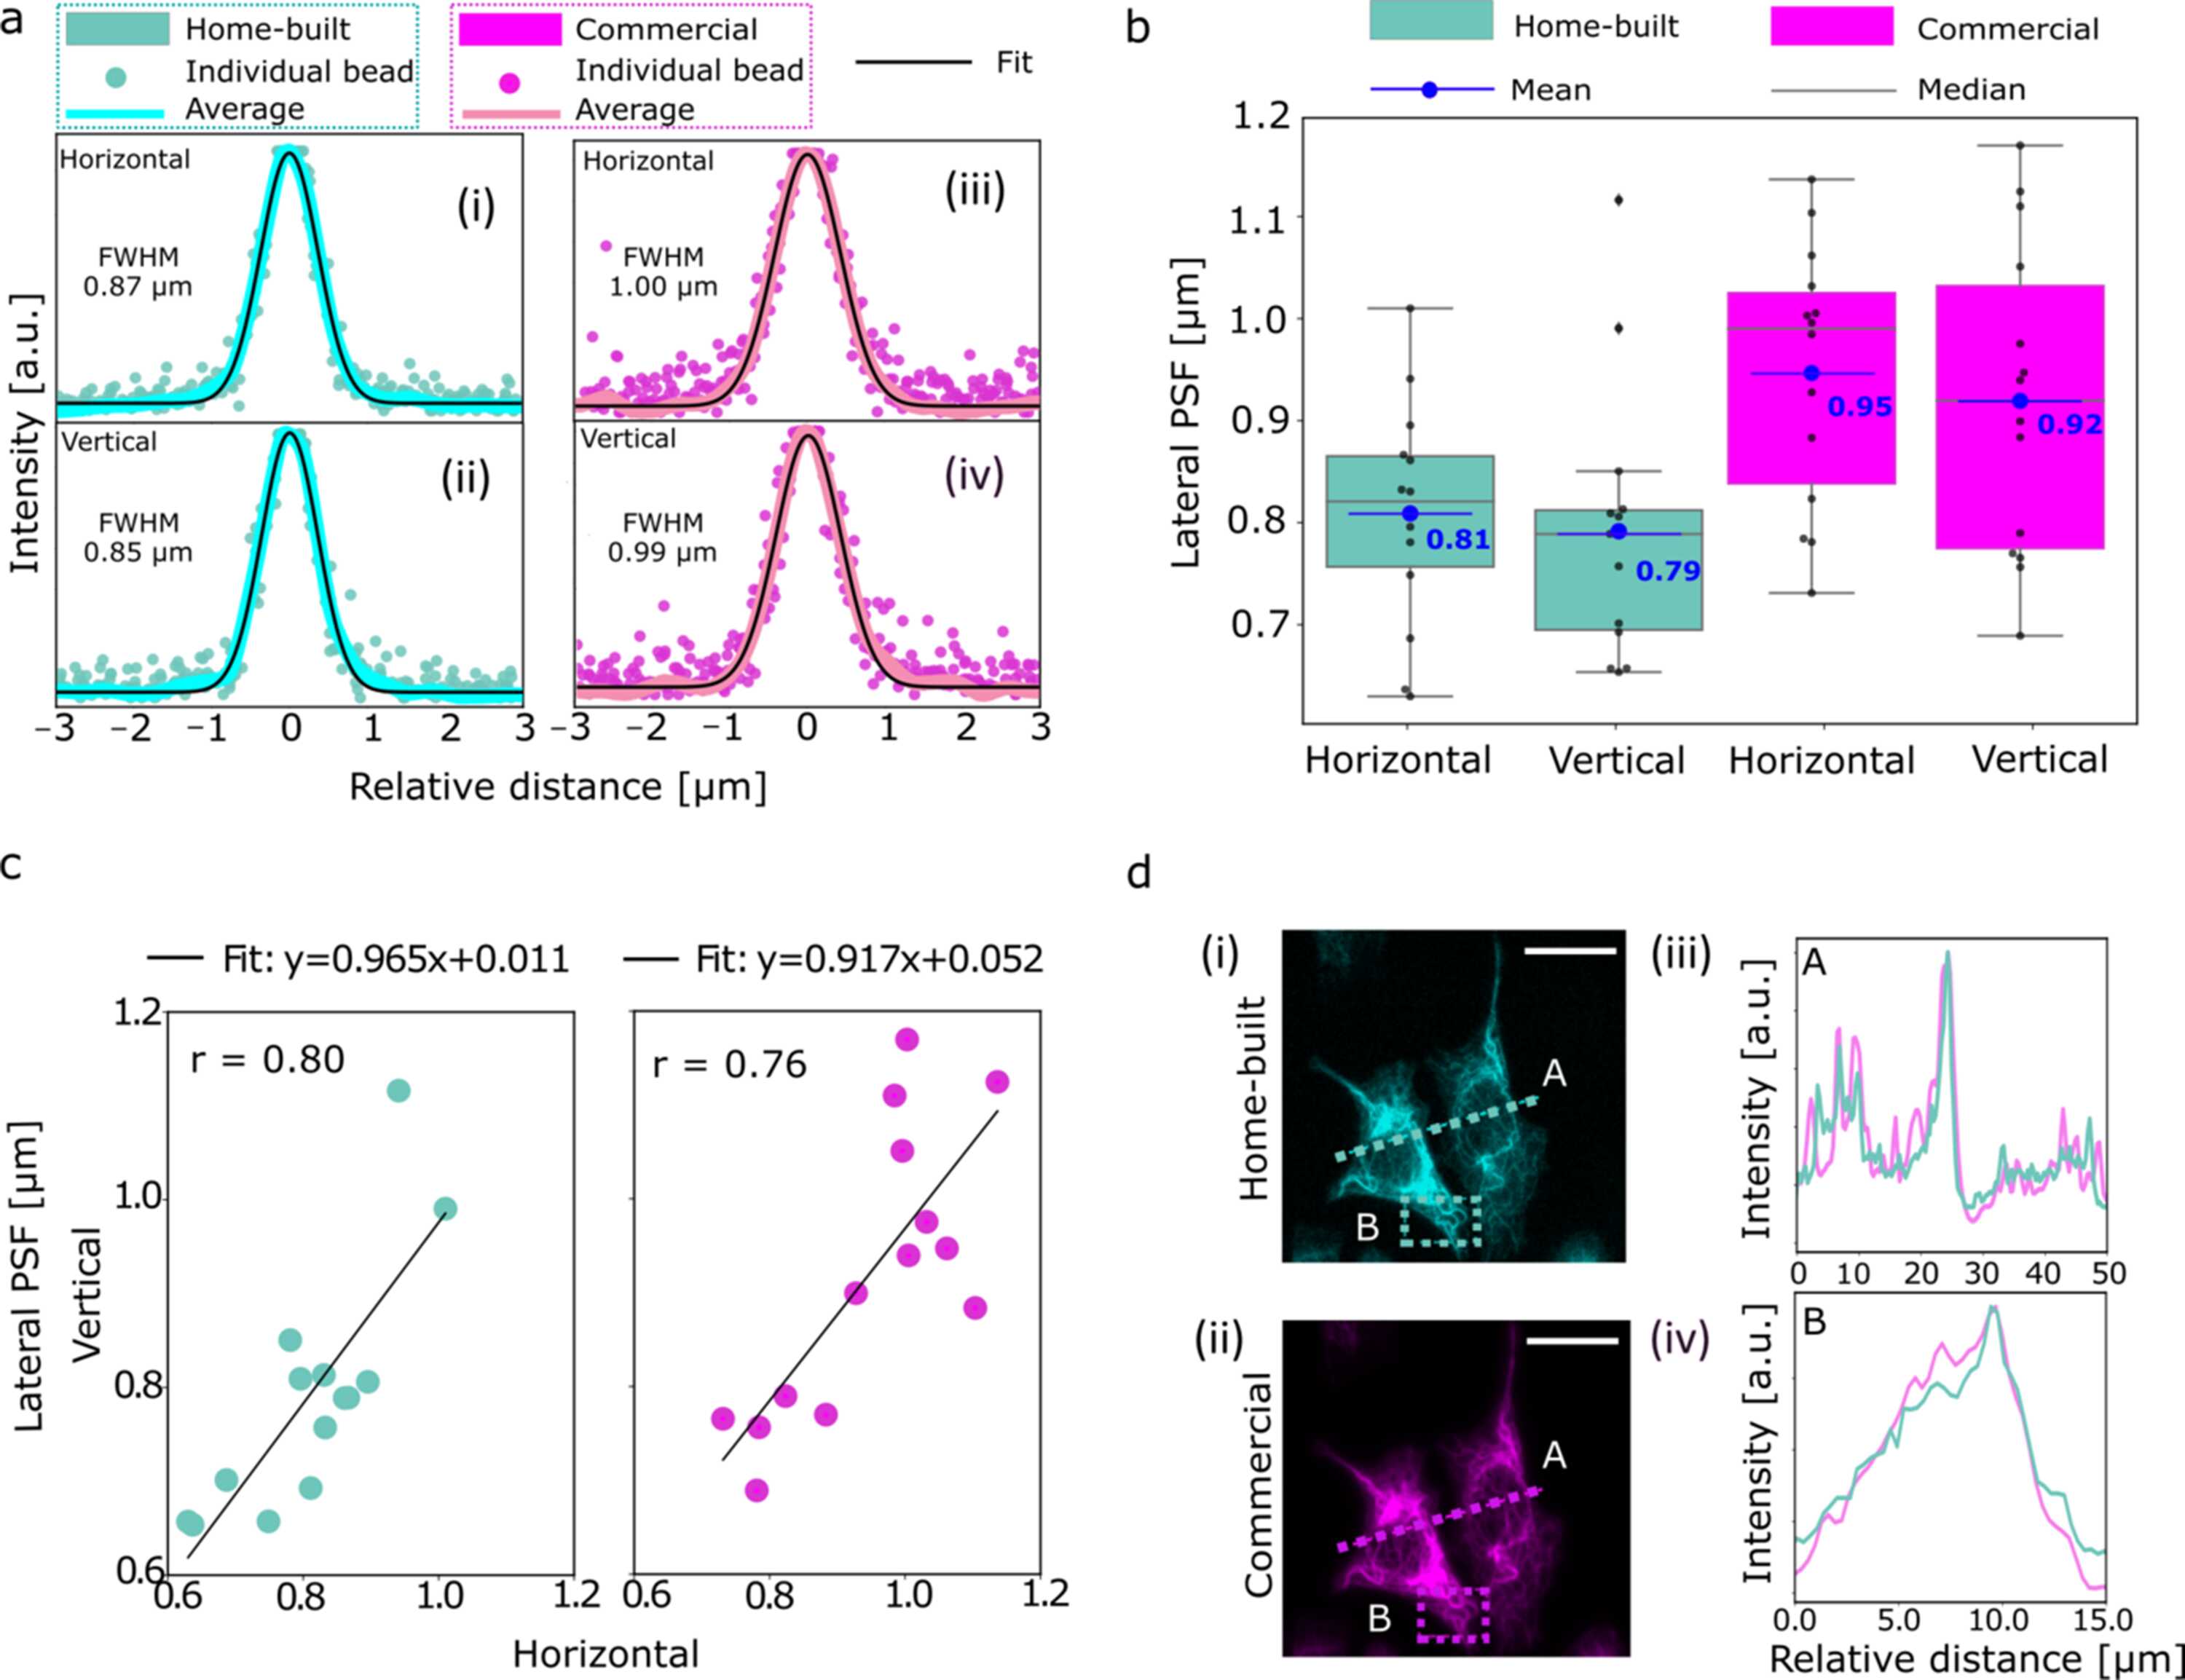
Figure 2
Performance characterization and validation of a compact fluorescence microscope for use in a synchrotron beamline. (a) Evaluation of the lateral PSF of the microscope using 0.1 µm-diameter fluorescent beads suspended in ultrapure water and deposited between two Si3N4 windows arranged in analogy to the actual measurements. Panels (i) and (ii) show the individual horizontal and vertical line intensity profiles of N = 14 beads (cyan, scatter) along with the averaged intensity profile (cyan, solid line) and the corresponding Gaussian fit (black, solid line). Panels (iii) and (iv) show the corresponding measurements for a commercial epi-fluorescence microscope (shown in magenta). Identical objectives and filter sets are used in both configurations. The FWHM denotes the lateral point spread function of the averaged horizontal and vertical profiles. (b) Quantitative comparison of the lateral point spread function between the home-built beamline microscope and the commercial system. The FWHM from the Gaussian fits of the individual horizontal and vertical line profiles of each of the N = 14 beads for each case are plotted as single data points (black). The box plots indicate the range of values between the 25th percentile and 75th percentile with the median (gray) and the mean (blue) of the distributions. (c) Correlation of bead FWHM in the horizontal and vertical axes in the focal plane, illustrating the degree of astigmatism. Each point represents an individual bead; the black lines show linear fits. (d) Images of keratin bundles in cells acquired from the same region on a sample using the home-built and a commercial microscope (scale bars: 20 µm). The normalized intensity profiles for A (dotted line) and B (dotted box) agree well. |
 | JOURNAL OF SYNCHROTRON RADIATION |
ISSN: 1600-5775
 access