

 menu
|
|
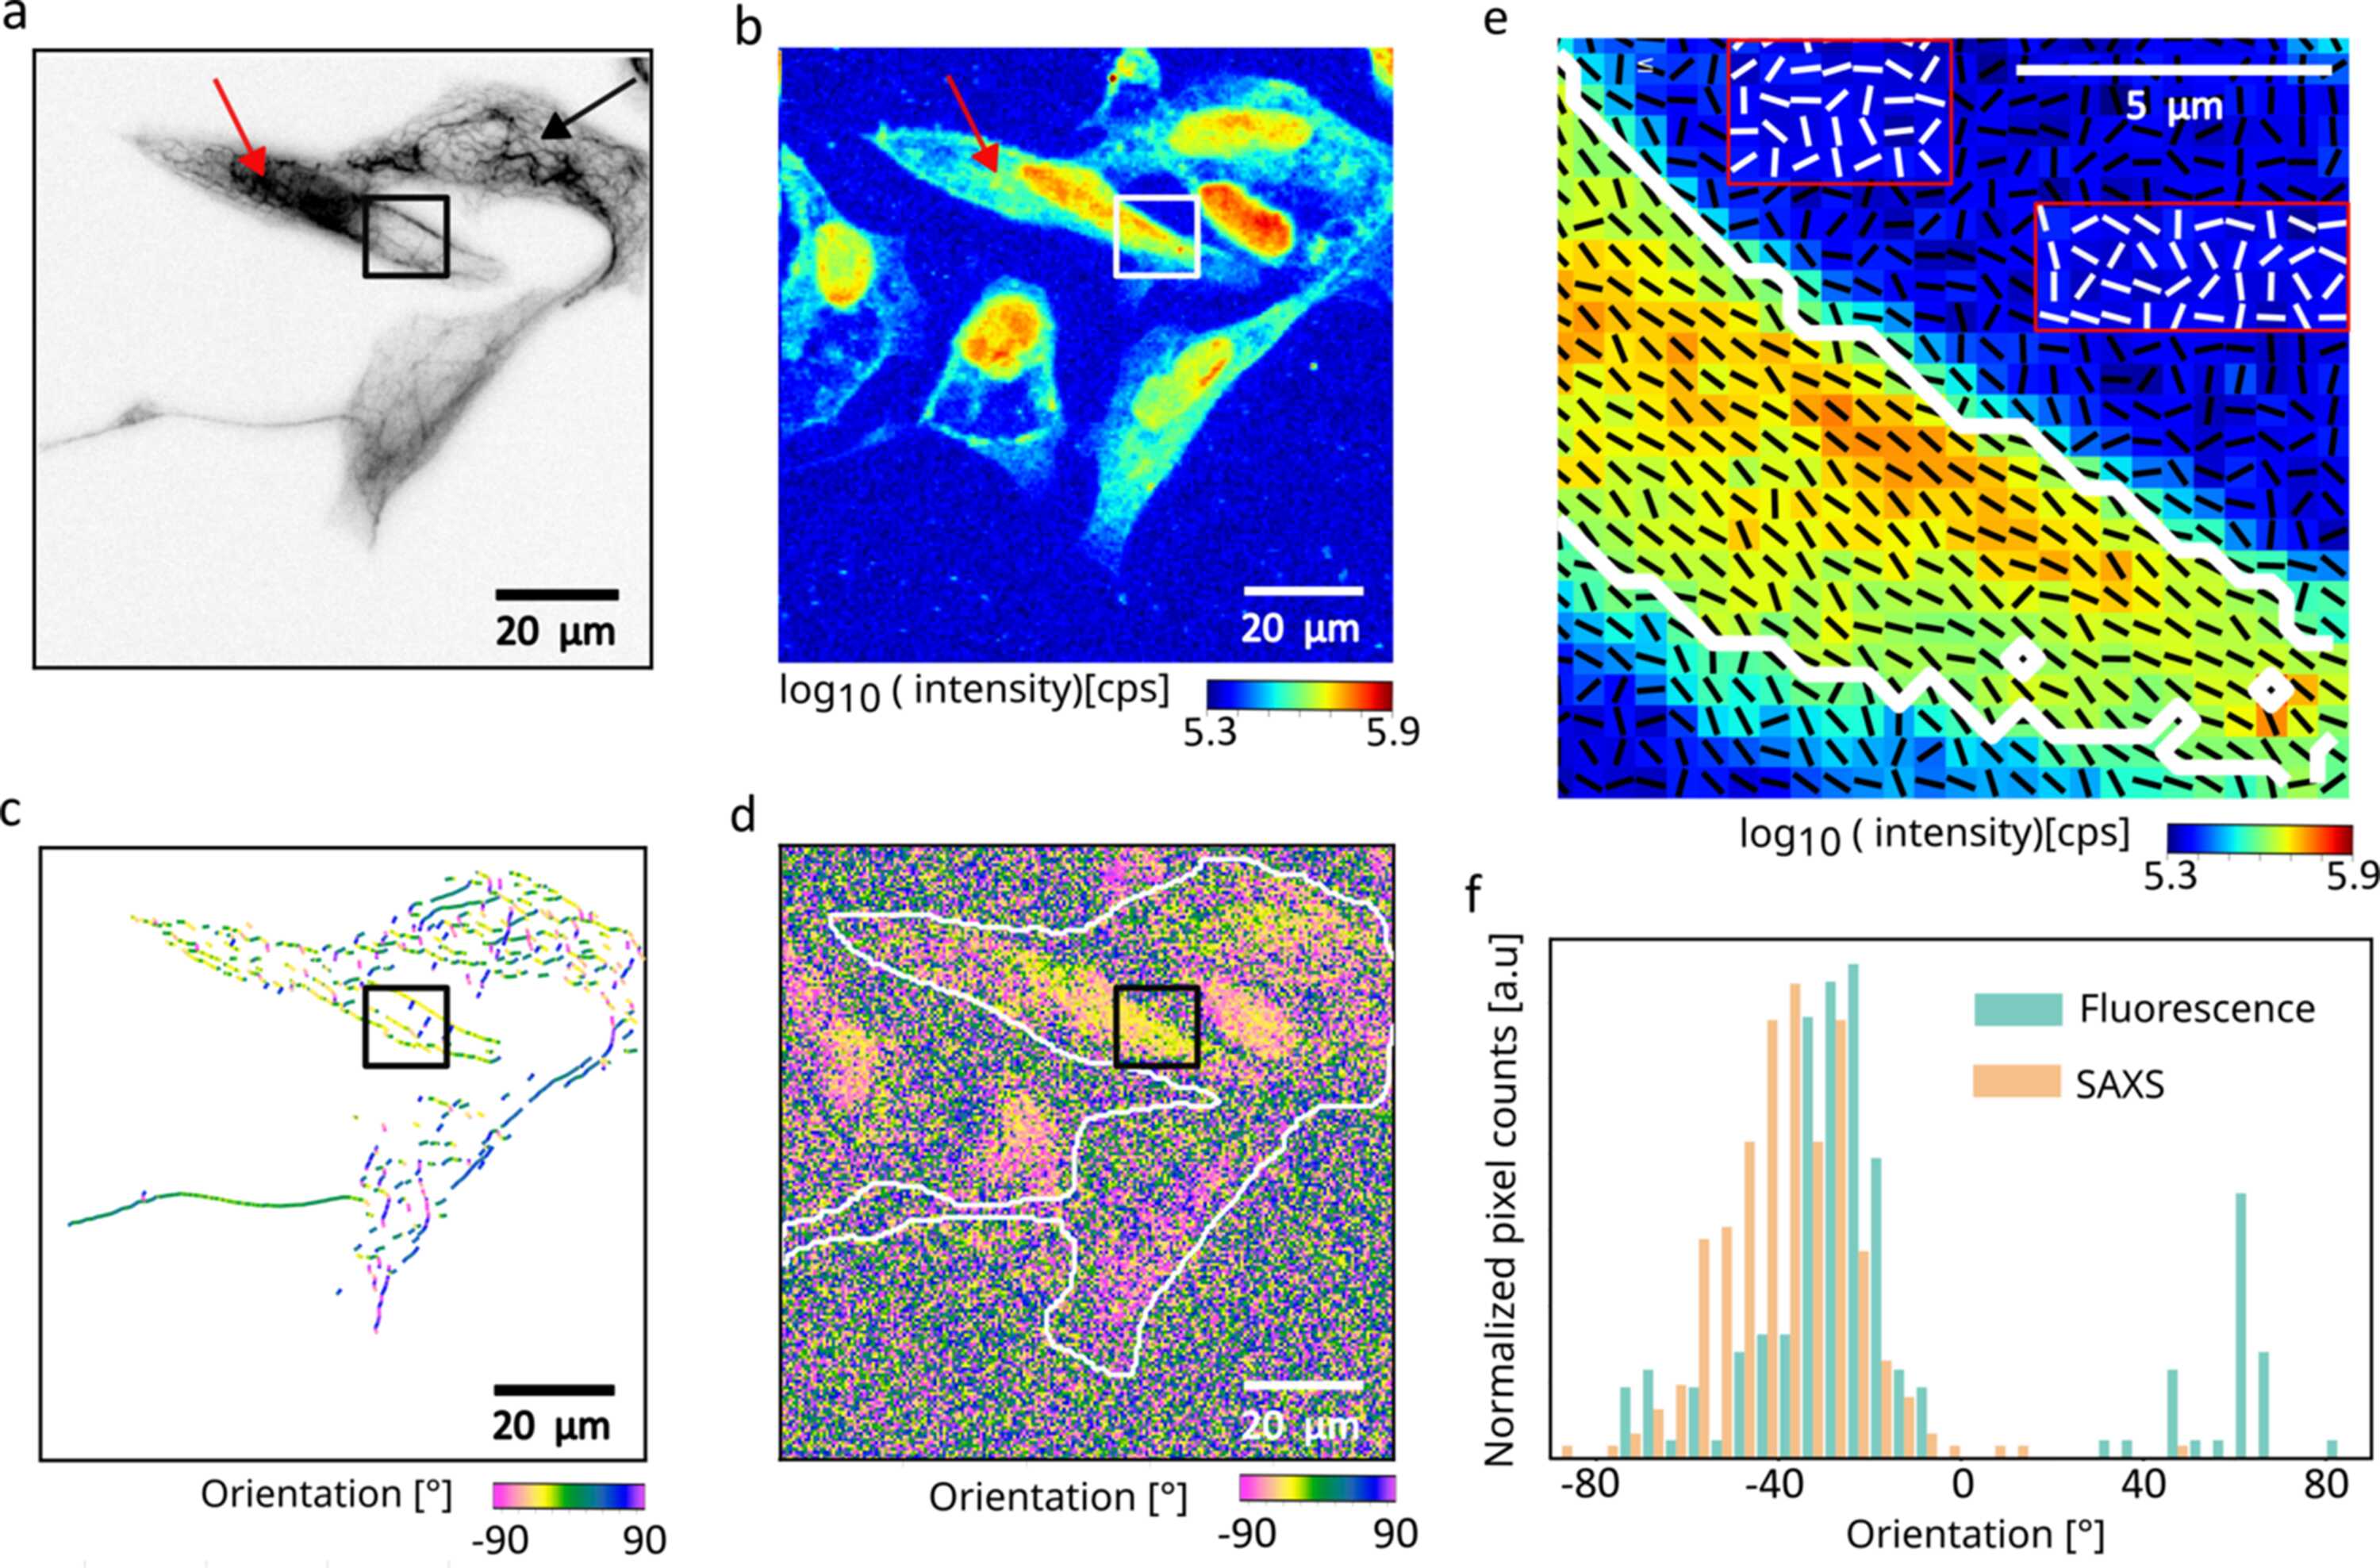
Figure 4
Correlative fluorescence and fast scanning SAXS analysis of keratin filament organization in SW-13 cells. (a) Inverted fluorescence image of keratin-rich SW-13 cells acquired using the home-built fluorescence microscope at the beamline. The black box highlights an area containing ordered keratin bundles, the black arrow points to wavy keratin structures, while the red arrow points to a dense keratin network. (b) X-ray dark-field image obtained from the scanning SAXS corresponding to the same region as shown in panel (a). The X-ray dark-field image reveals additional cells that do not express keratin and therefore do not show a fluorescence signal. (c) Bundle networks are detected from the fluorescence image using SOAX and are color-coded by their orientation. (d) SAXS-derived orientation map. The white outlines indicate the keratin-expressing cells as shown in panel (a). (e) Overlay of the X-ray dark-field image with black lines representing the SAXS-determined orientation of ordered structures as shown in the black box in panel (a). Selected background regions are marked by red boxes, with white line segments indicating their corresponding orientations for enhanced visibility. Pixels within the white contour correspond to areas of high X-ray scattering intensity within the ordered structure. (f) Orientation histograms obtained from SAXS and fluorescence analysis for the same region within the white outline in panel (d) show consistent alignment trends between the two modalities. |
 | JOURNAL OF SYNCHROTRON RADIATION |
ISSN: 1600-5775
 access