

 menu
|
|
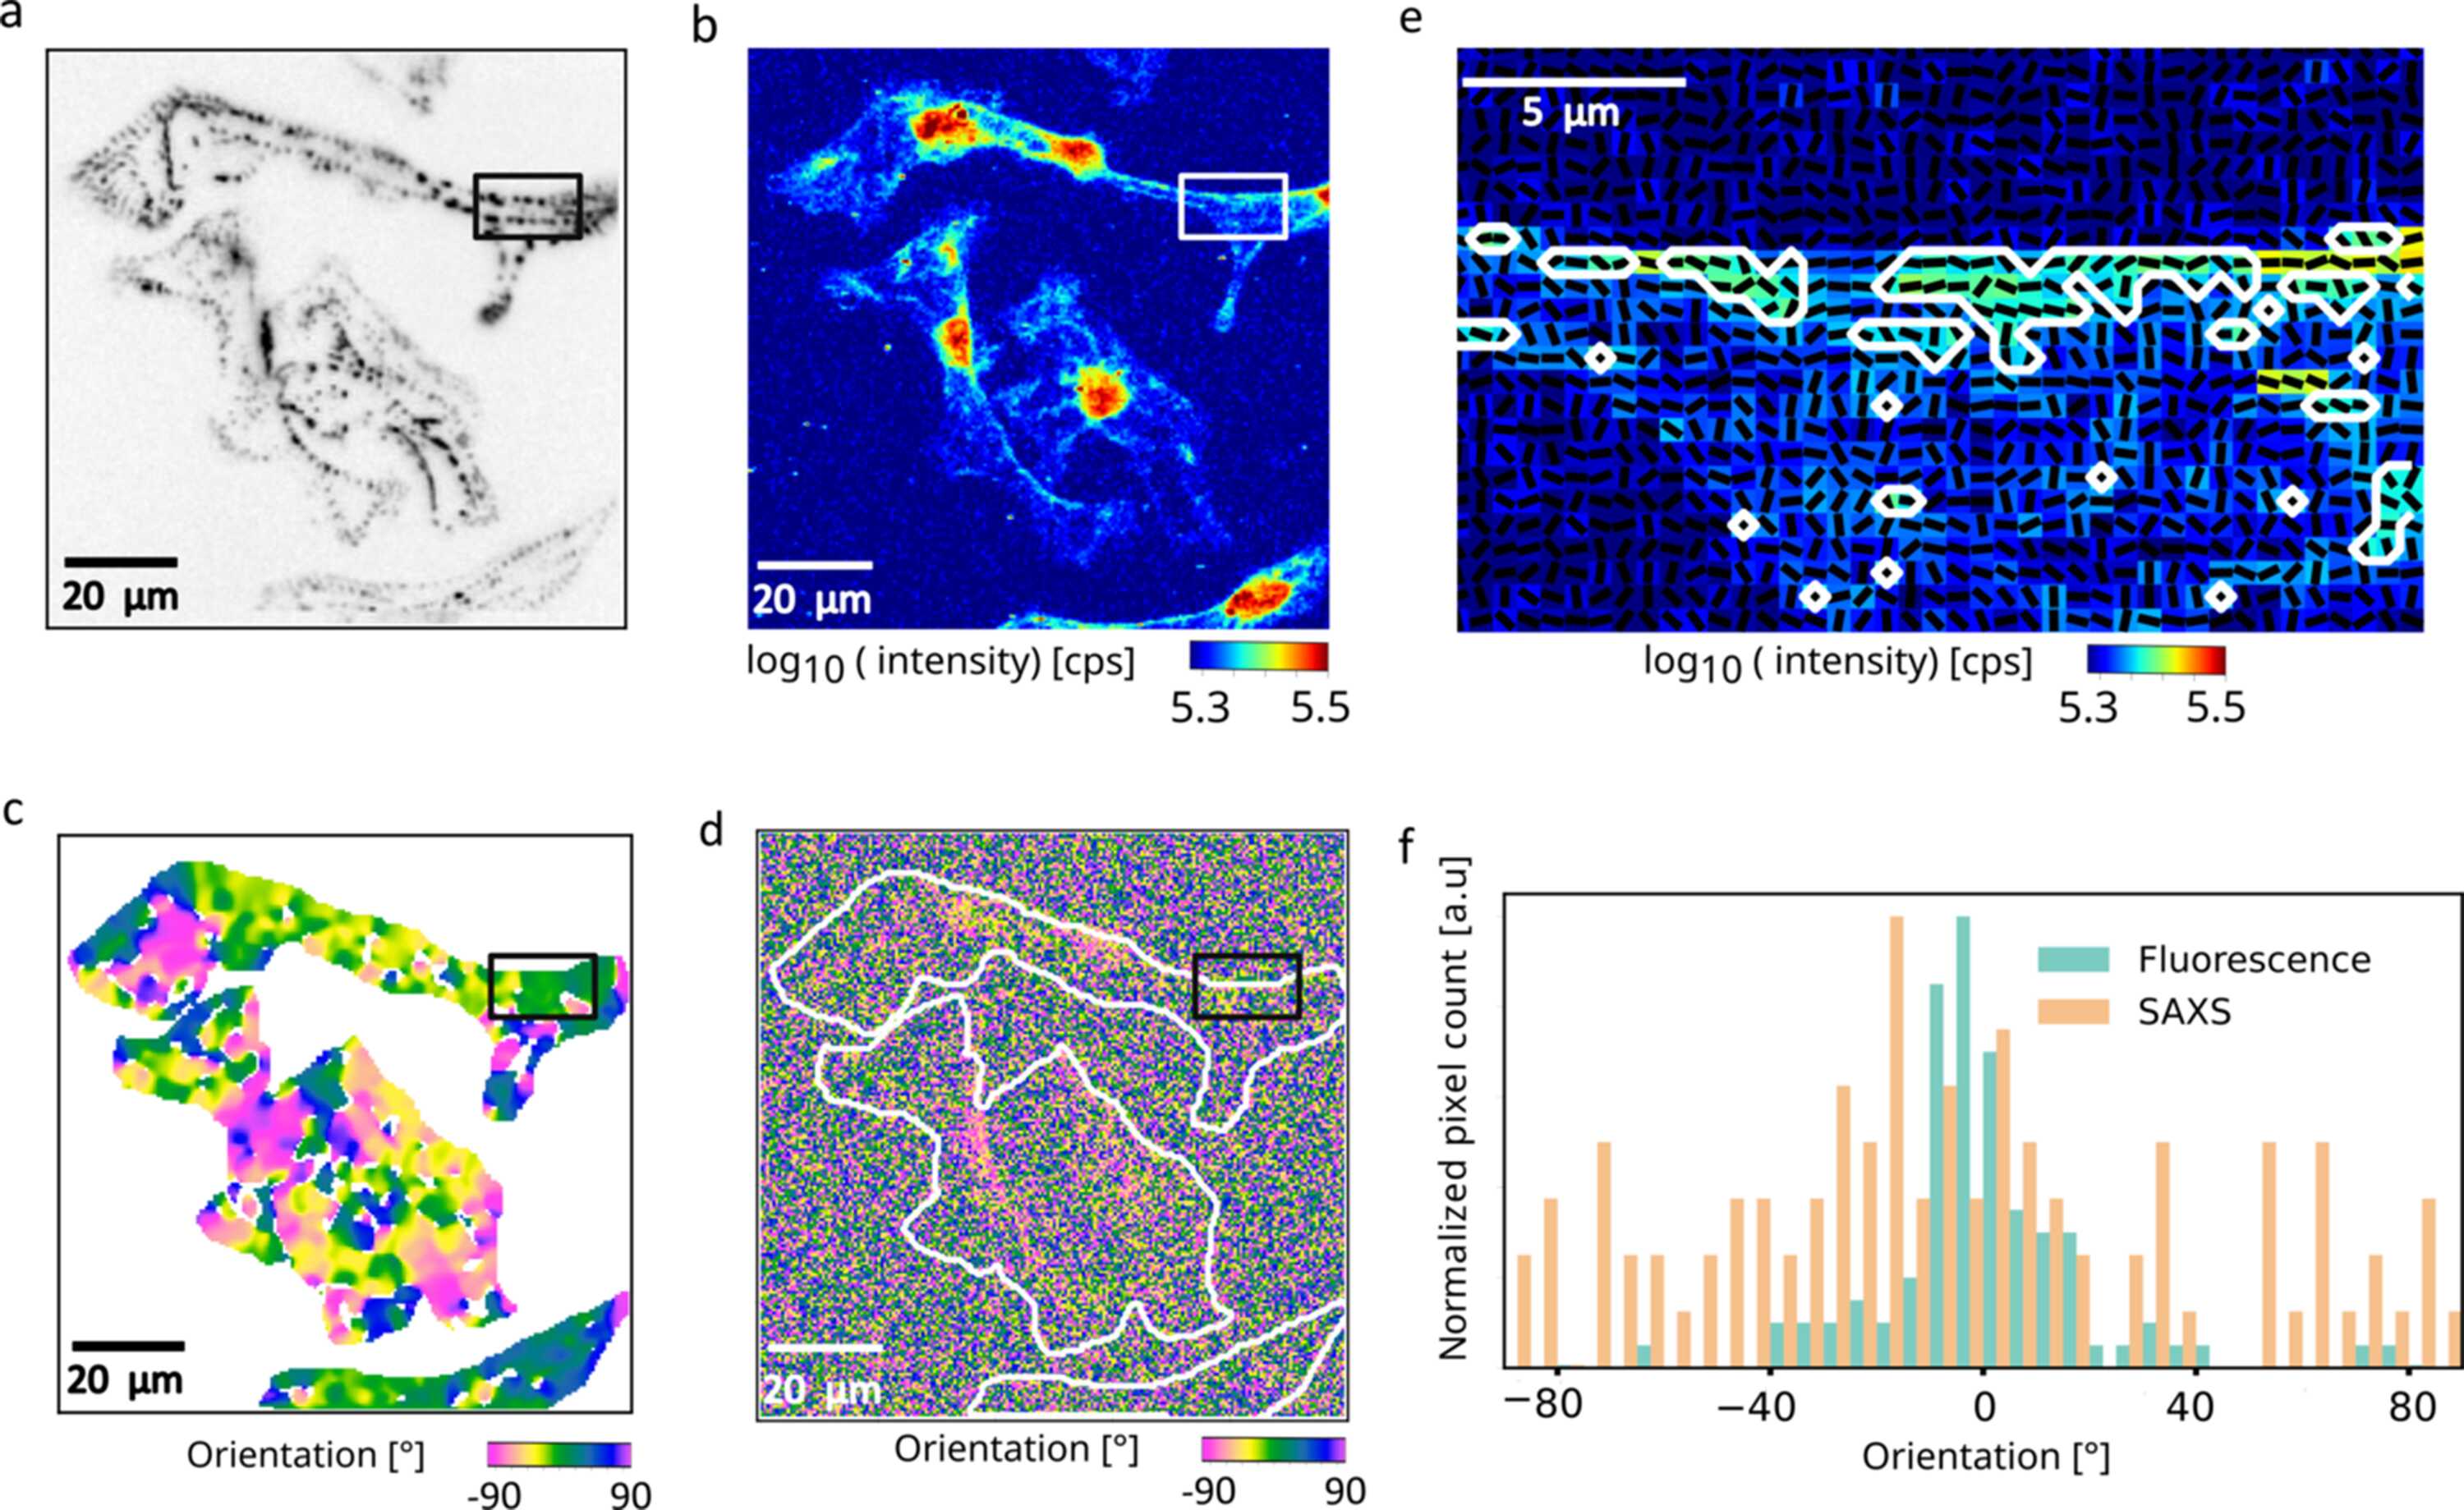
Figure 5
Correlative fluorescence and fast scanning SAXS analysis of sarcomeric organization in hiPSC-ACTN2-citrine-derived cardiomyocytes. (a) Inverted fluorescence image of α-actinin-labeled Z-disks with the periodic sarcomeric arrangement within the cardiomyocytes. The region within the black box highlights a representative area containing Z-disks. (b) The corresponding X-ray dark-field image reveals contrast differences between nucleus and the cytoplasm. (c) Orientation map derived from the fluorescence image of α-actinin-labeled Z-disks (d) SAXS-derived orientation map. The white outlines indicate the cells as shown in panel (a). (e) Overlay of the X-ray dark-field image with black lines representing the SAXS-determined orientation of the region within the black box in panel (a). Pixels within the white contour correspond to areas of high X-ray scattering intensity, where prominent Z-disks are observed in the fluorescence image. (f) Orientation histograms obtained from SAXS and fluorescence analysis for the same region within the white outline as shown in panel (e). |
 | JOURNAL OF SYNCHROTRON RADIATION |
ISSN: 1600-5775
 access