

 menu
|
|
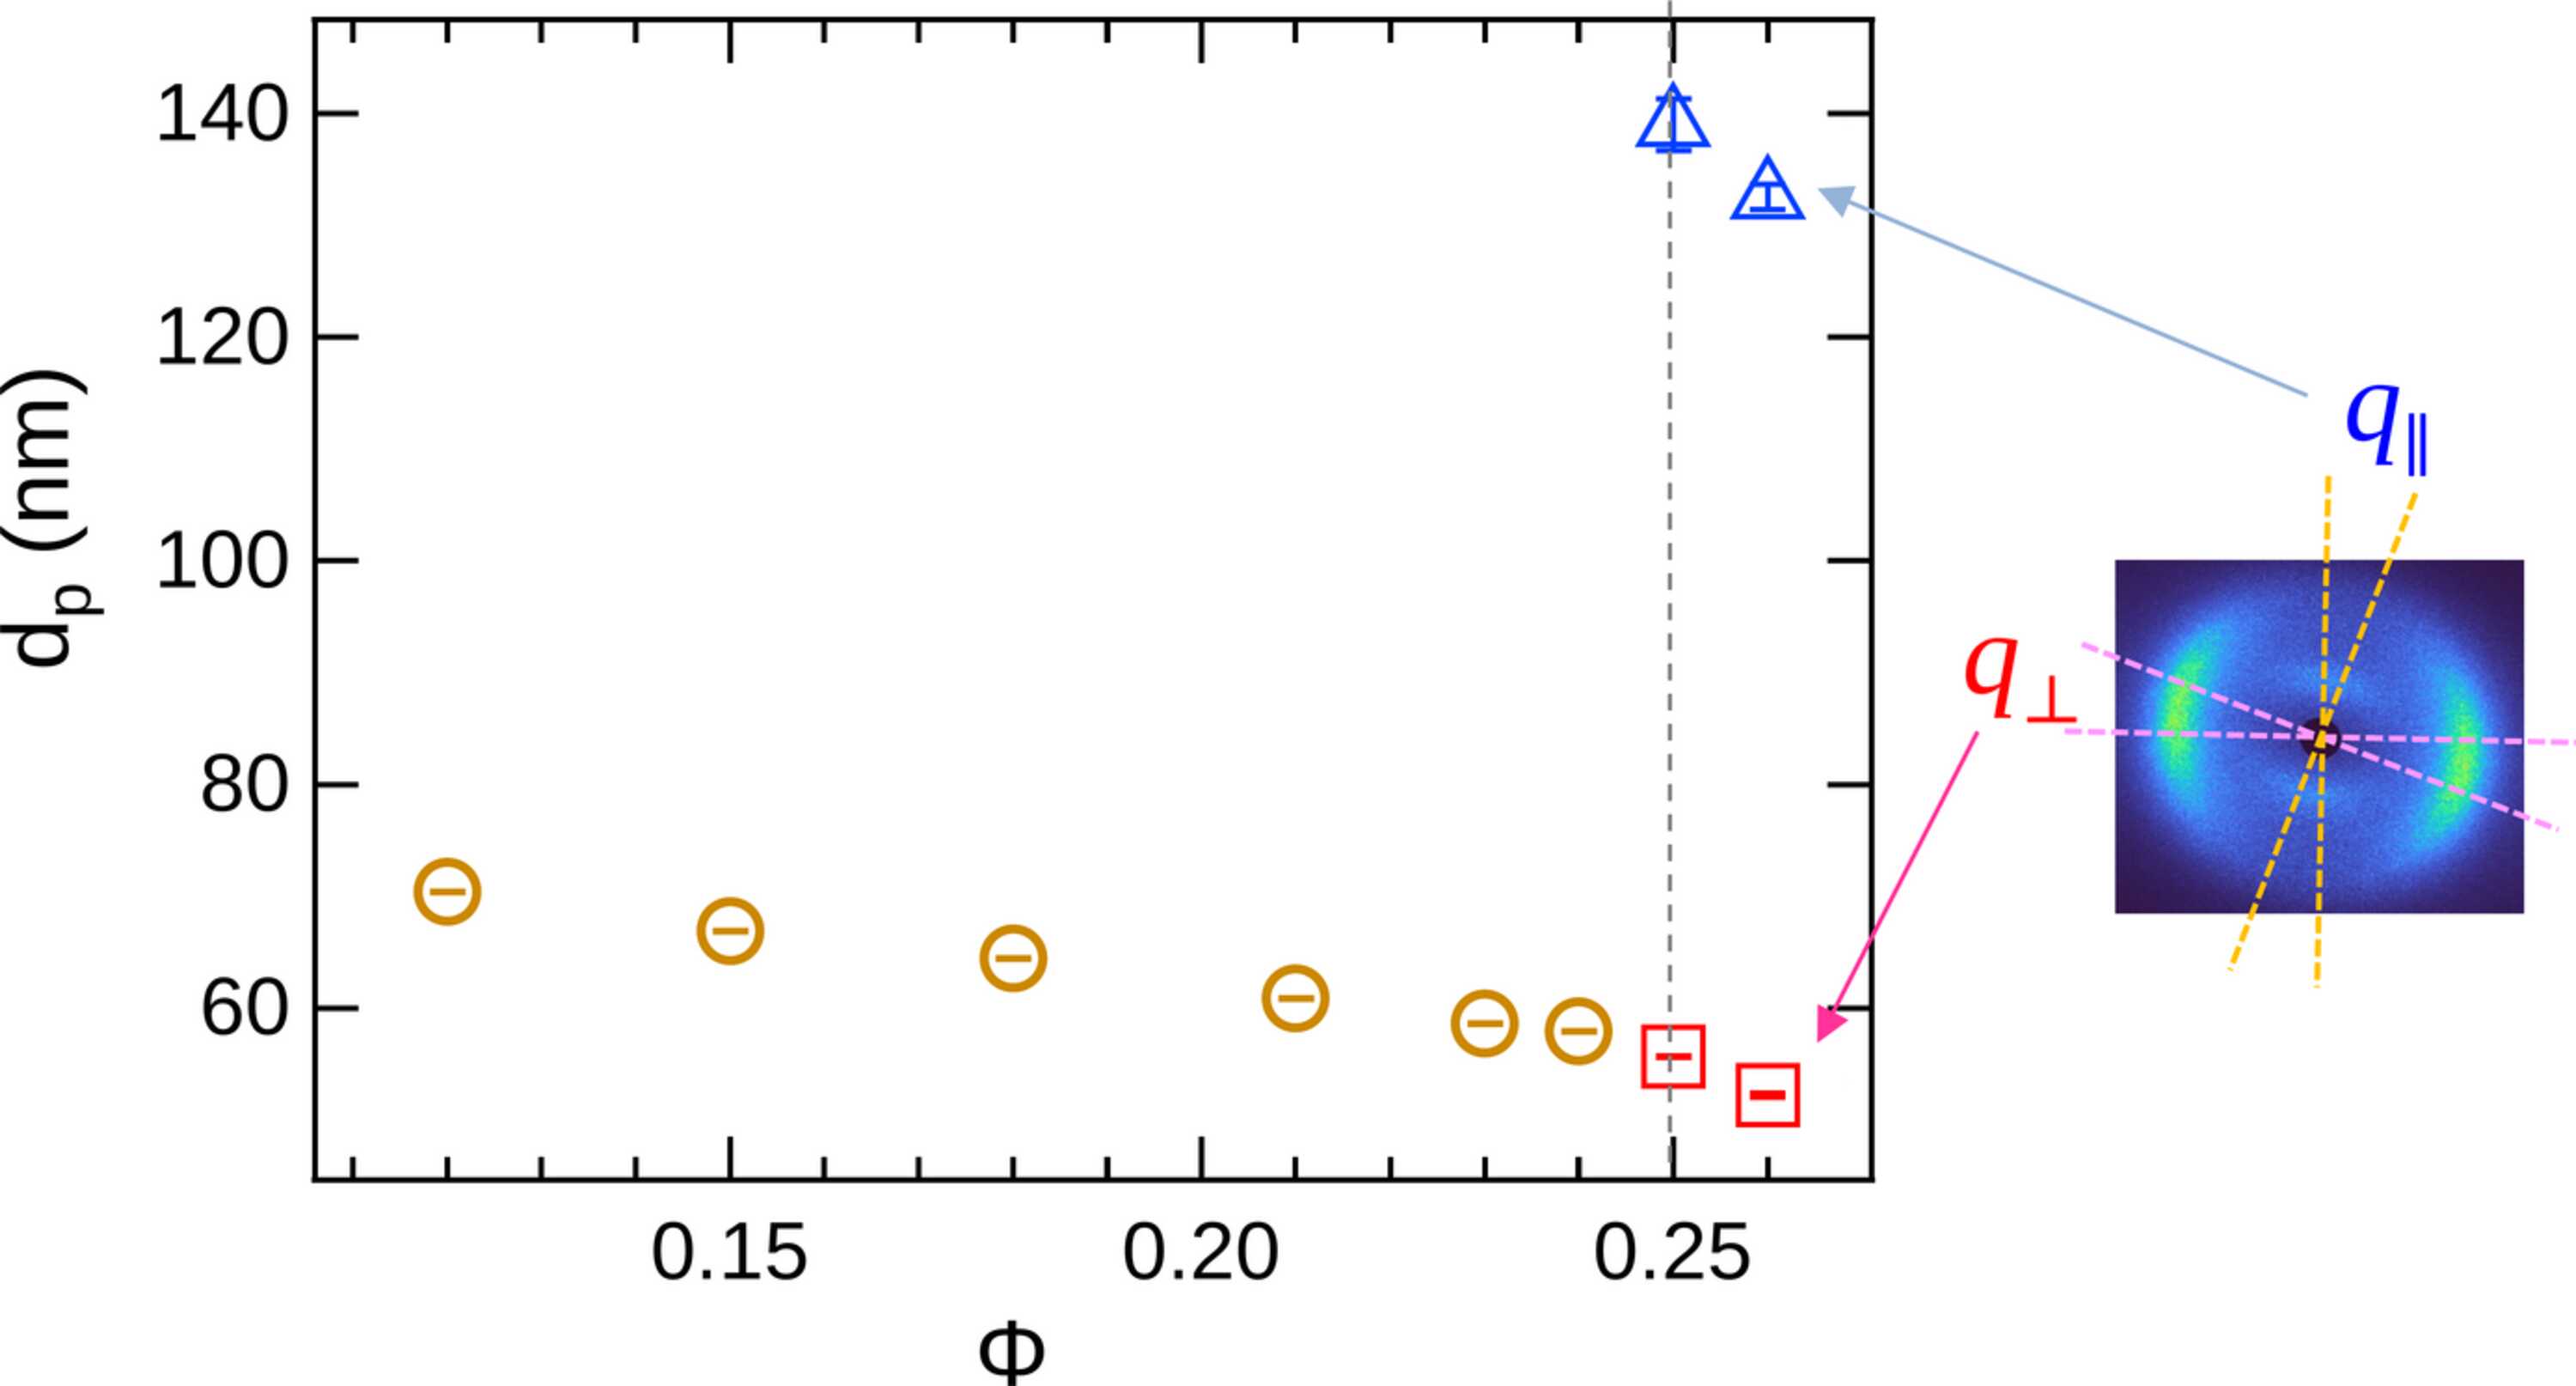
Figure 2
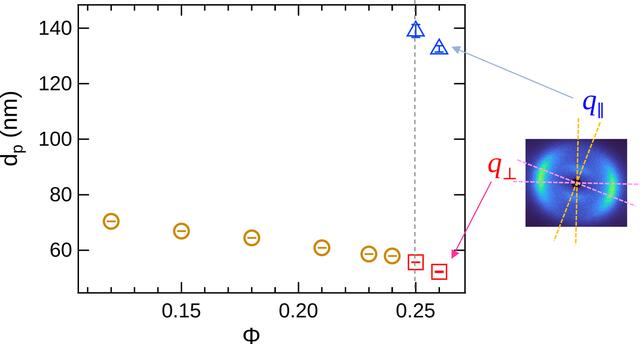
Concentration dependence of the characteristic interparticle distance dp. For Φ ≤ 0.24, dp is plotted as circles. For Φ ≥ 0.25, dp for the long-axis (  ) and the short-axis (  ) directions is plotted as triangles and squares, respectively. |
 | JOURNAL OF SYNCHROTRON RADIATION |
ISSN: 1600-5775
 access