

 menu
|
|
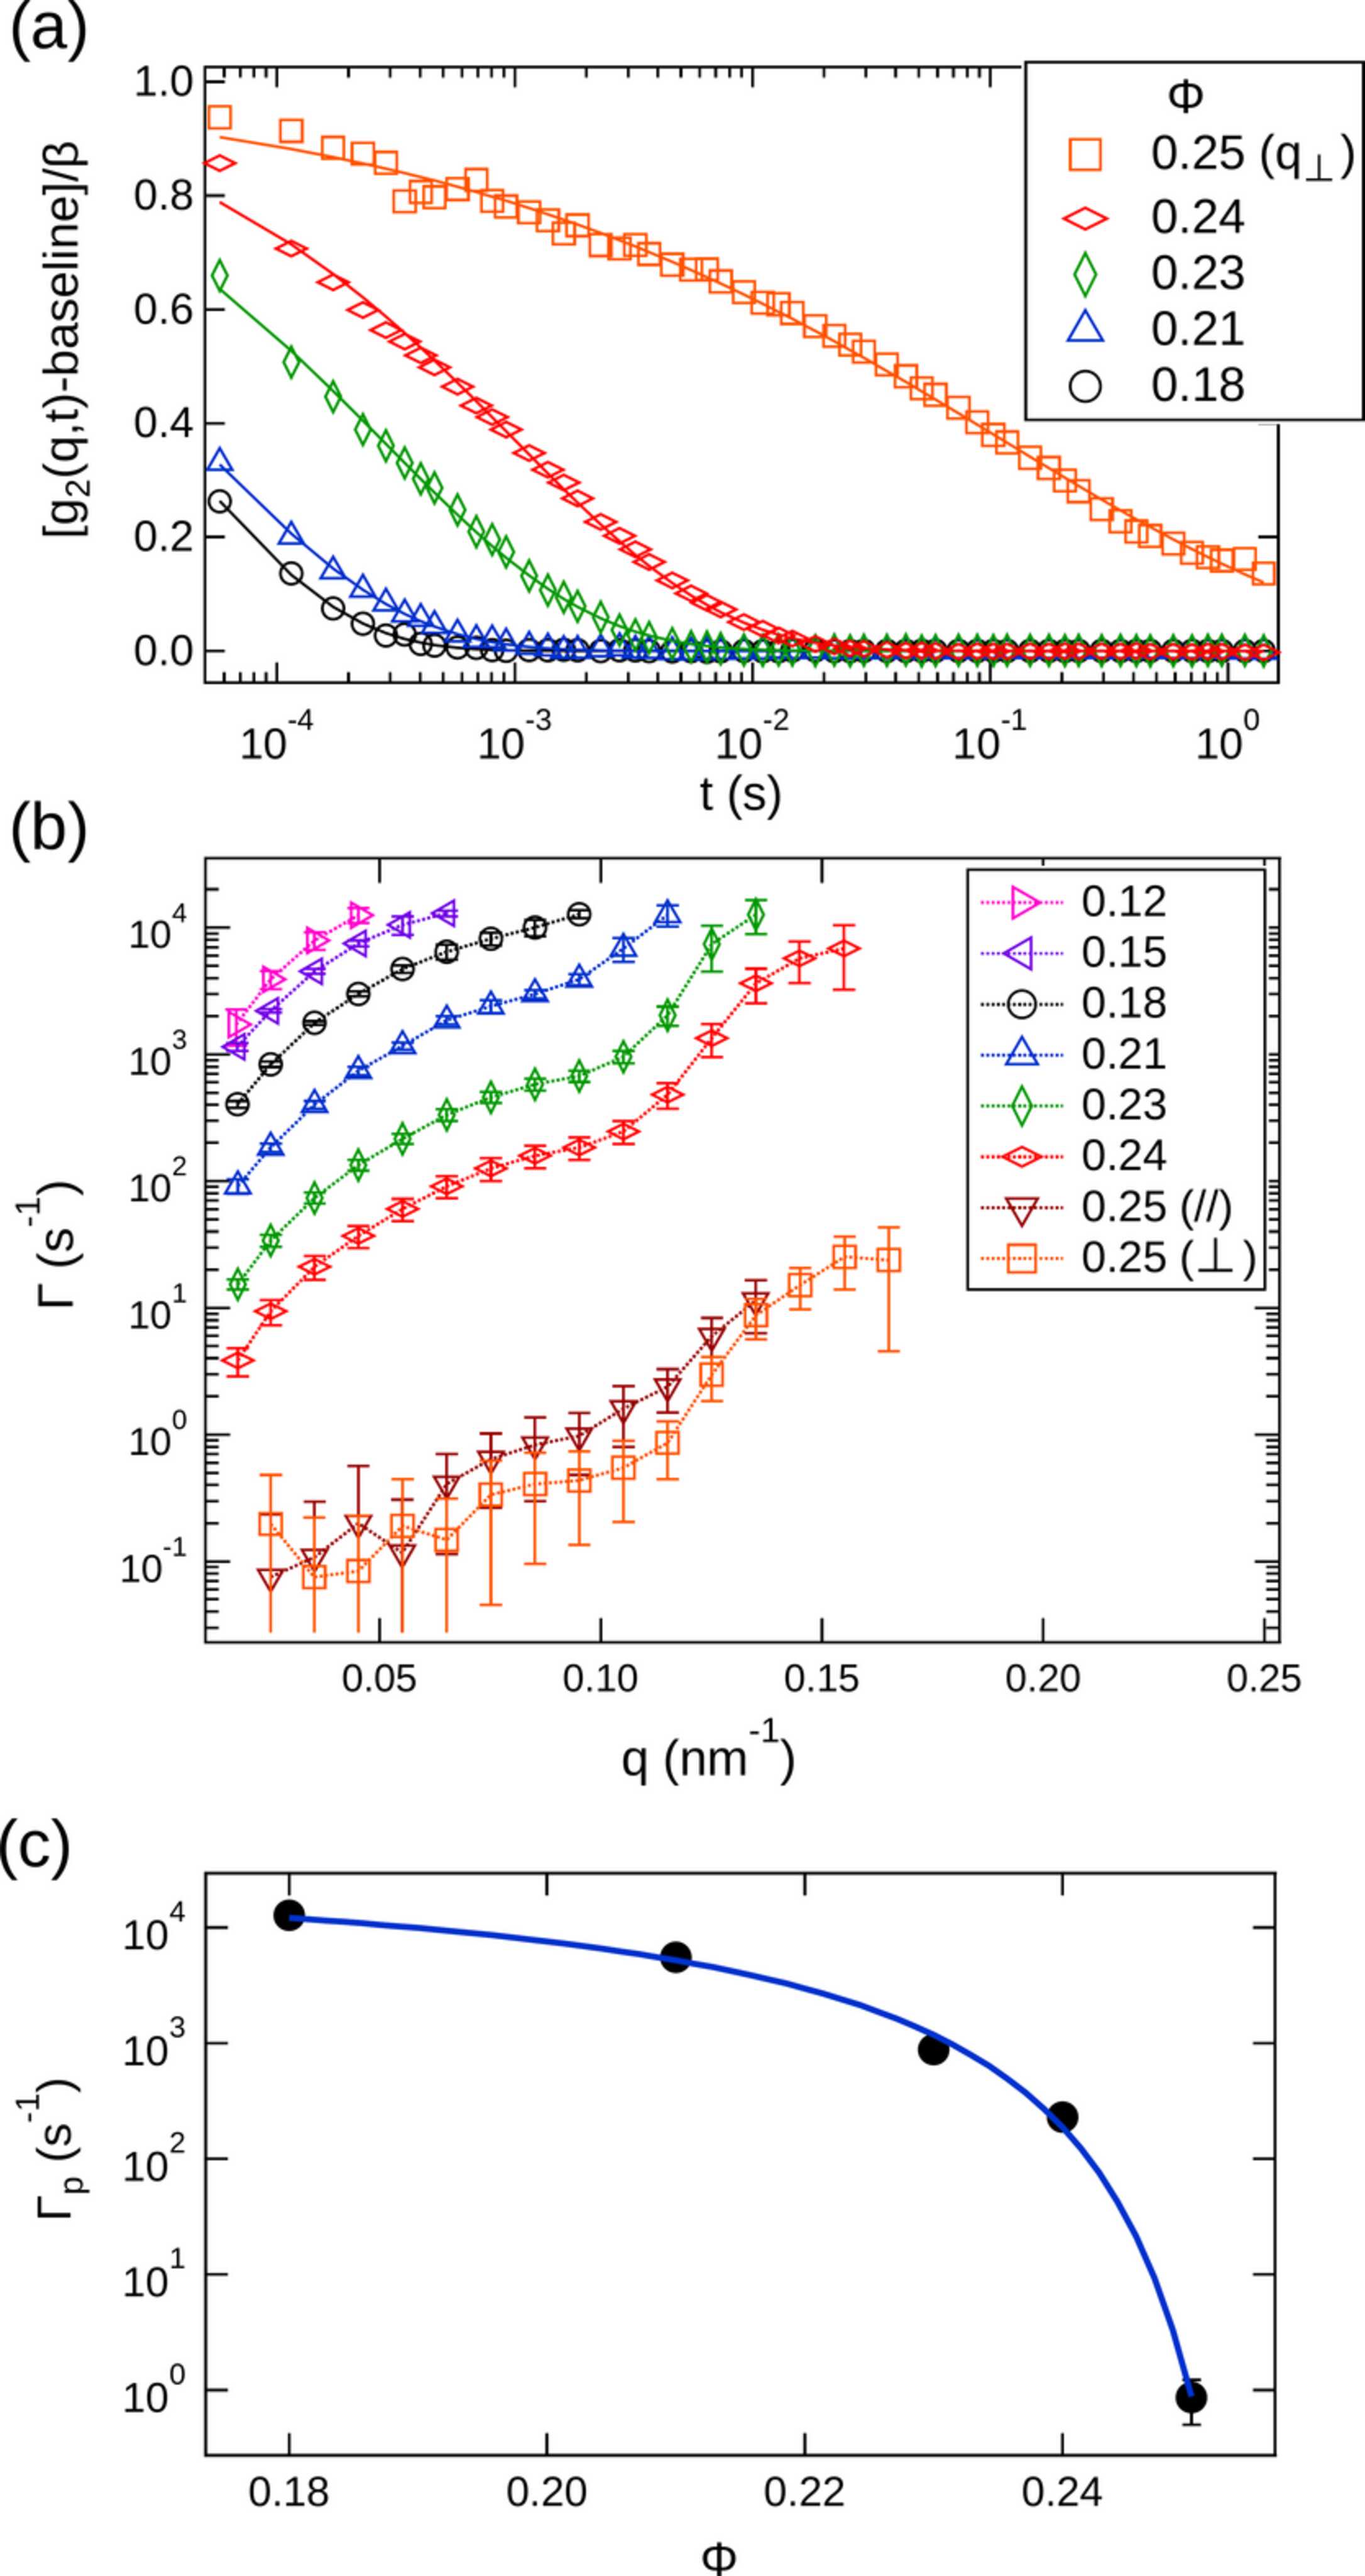
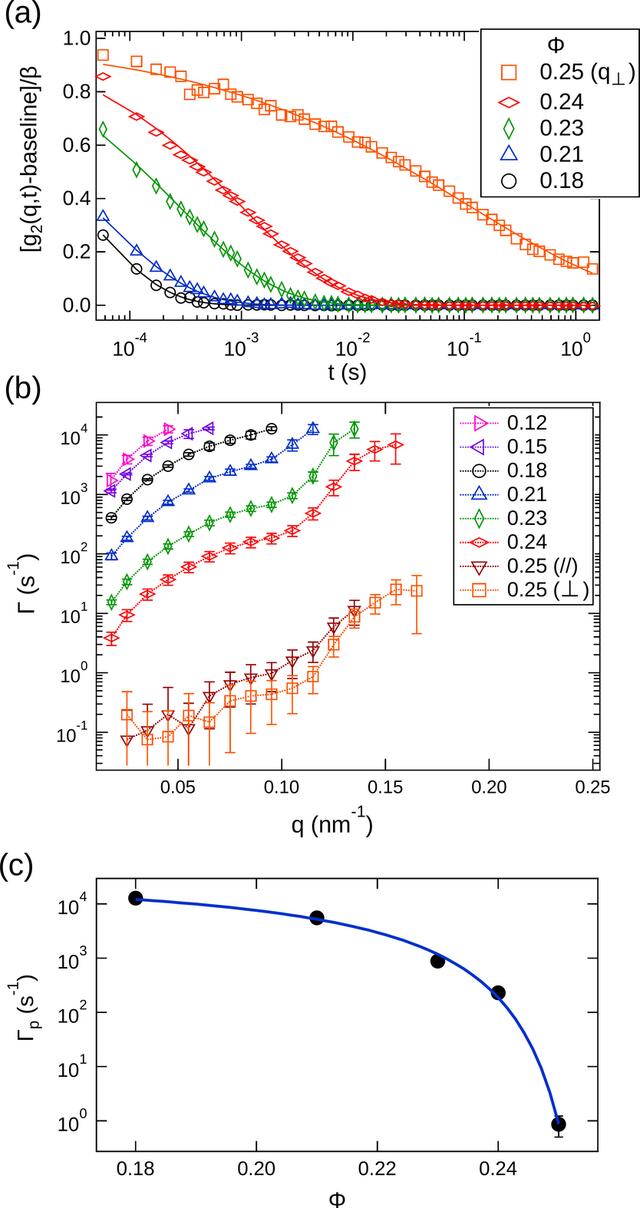
Figure 4
(a) g2 at qp for various concentrations. The solid lines represent the fitted curves obtained using equation (3)  . At Φ = 0.25, g2 obtained in the direction of the short axis (  ). (b) q dependence of Γ for various Φ. (c) Concentration dependence of Γp. The solid line is the fitting curve for Γp = Cexp[FΦ/(Φ0 − Φ)]. |
 | JOURNAL OF SYNCHROTRON RADIATION |
ISSN: 1600-5775
 access