

 menu
|
|
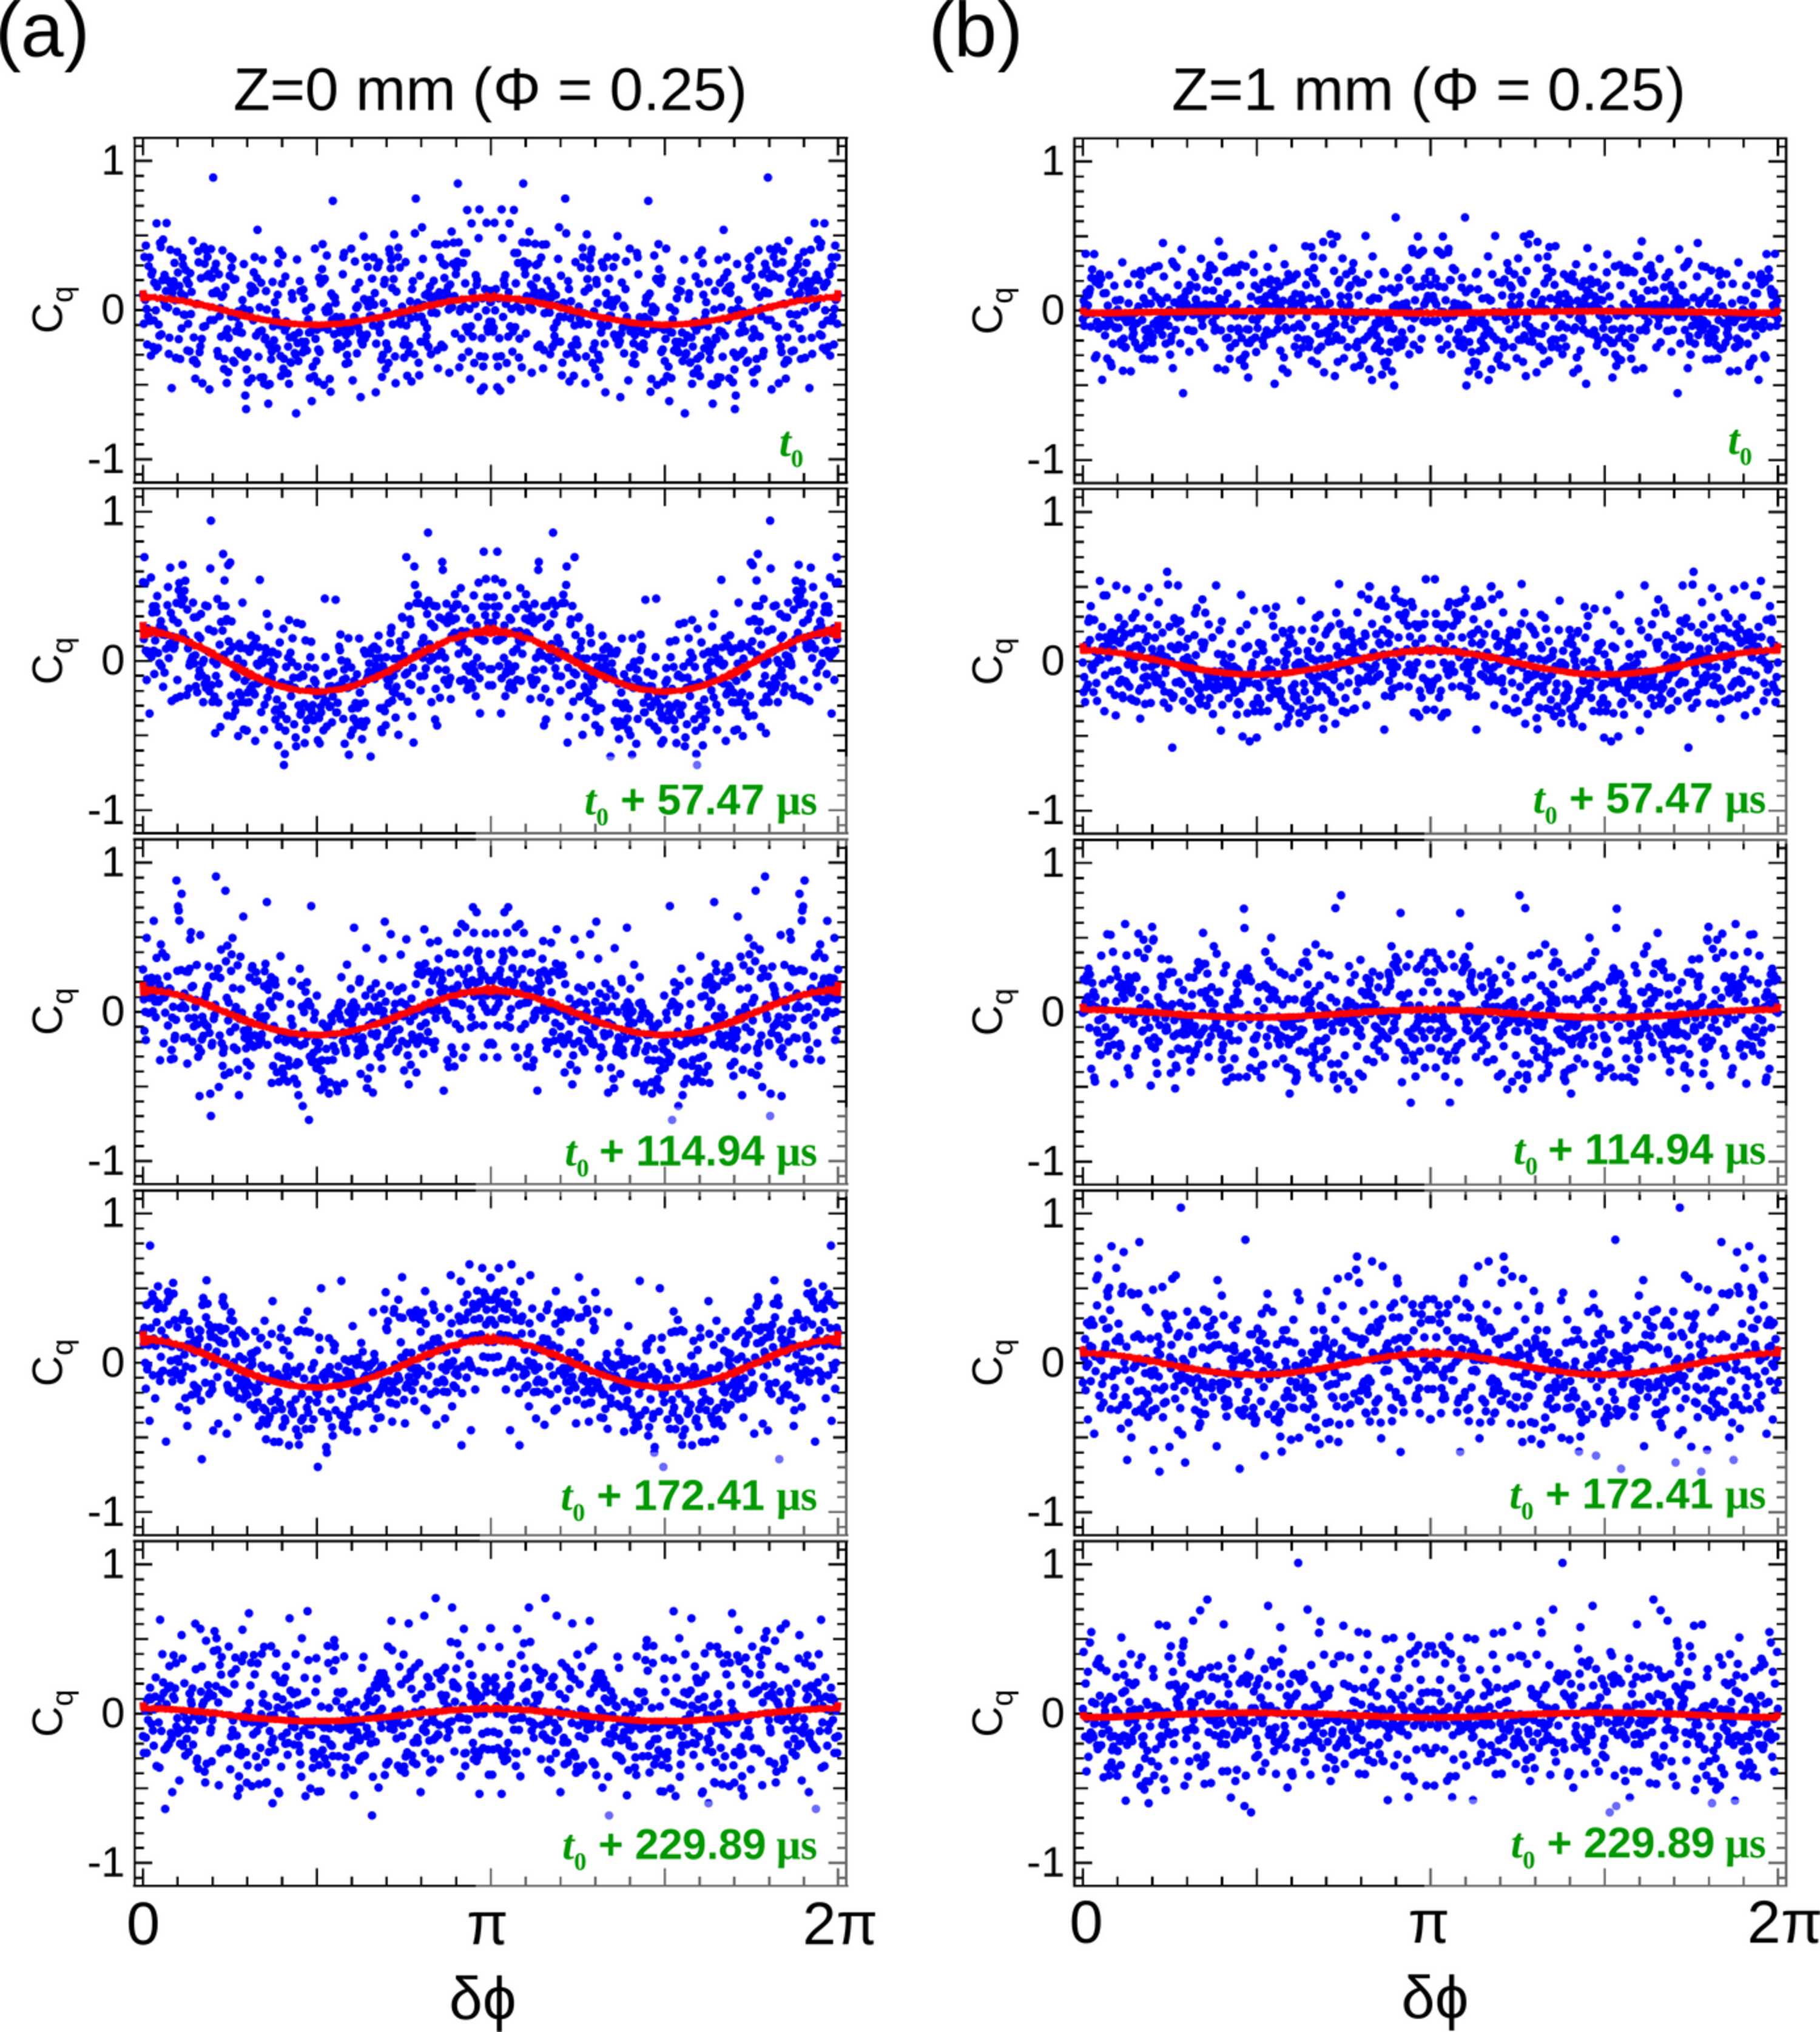
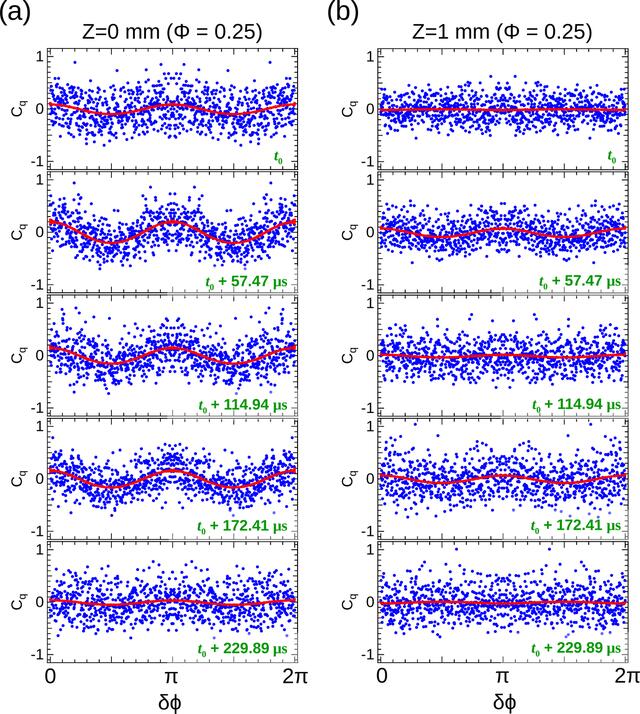
Figure 6
AXCCF calculated for the azimuthal profile at q = 0.1130 nm−1 from five consecutive images (17.4 kHz) at Z = 0 mm (a) and Z = 1 mm (b) for Φ = 0.25. Red lines: the first principal component obtained from PCA of the experimental AXCCFs. |
 | JOURNAL OF SYNCHROTRON RADIATION |
ISSN: 1600-5775
 access