

 menu
|
|
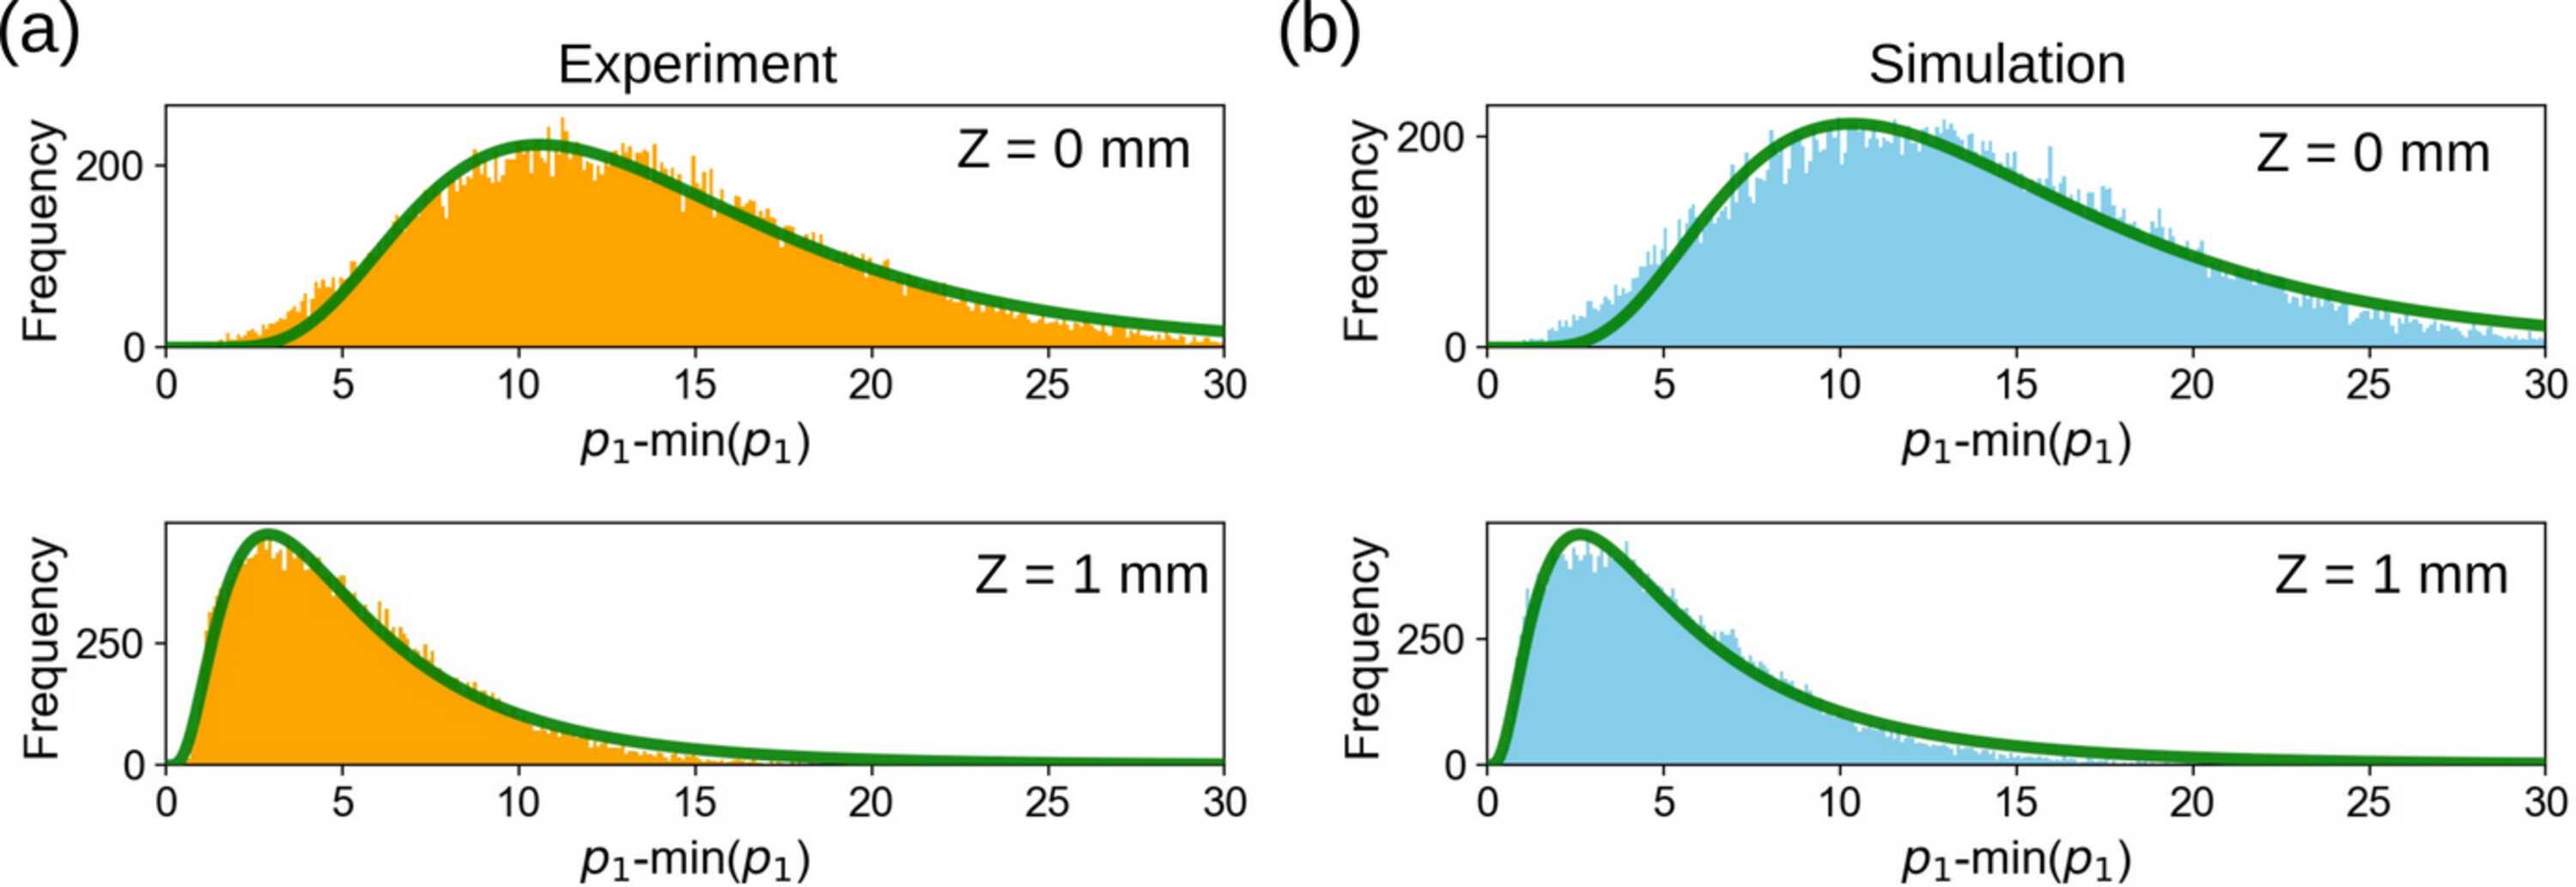
Figure 7
Distributions of the PC1 scores at Z = 0 and 1 mm for experimental data (a) and simulated data (b). The simulated data were projected onto the PCA basis obtained from the experimental AXCCFs. Green lines: fitting curves using the lognormal distribution. |
 | JOURNAL OF SYNCHROTRON RADIATION |
ISSN: 1600-5775
Open  access