

 menu
|
|
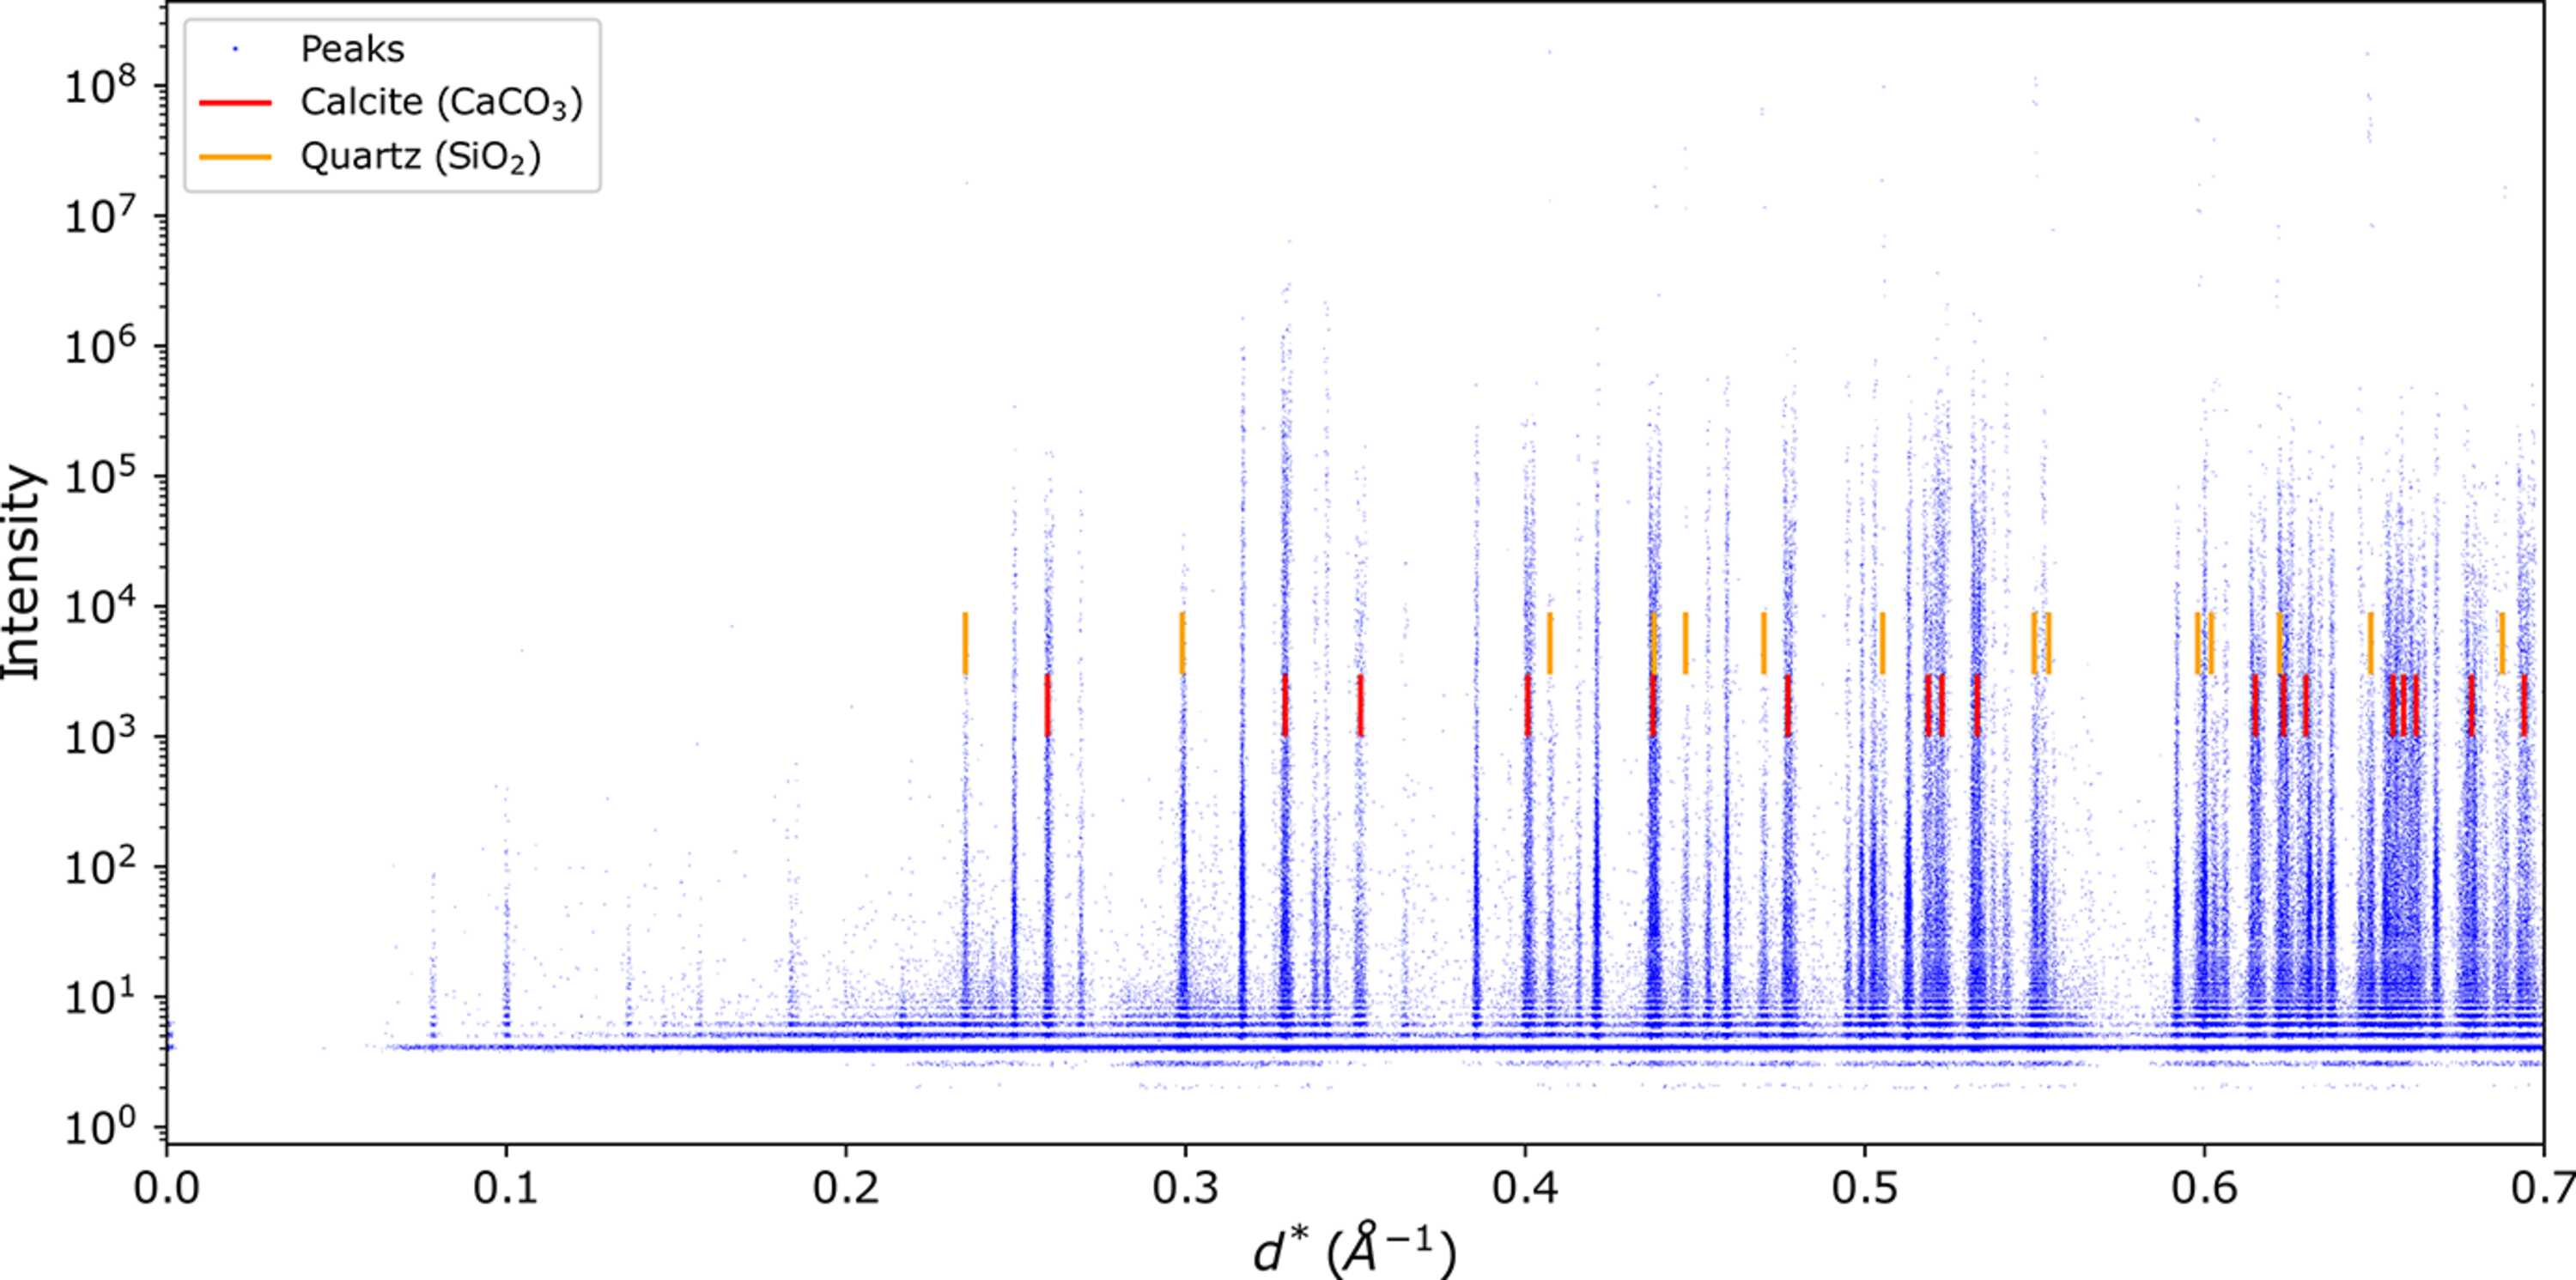
Figure 2
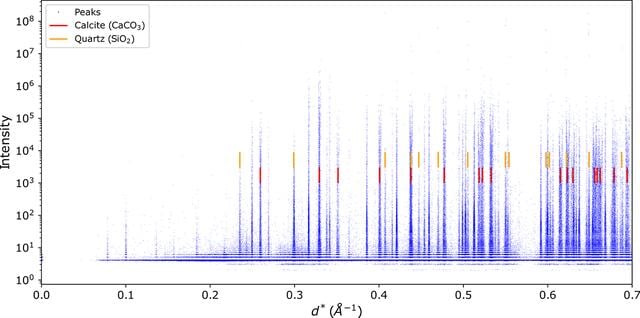
Plot showing the diffracted peak intensity against d *, with the rings corresponding to calcite and quartz, for a layer in sample B after the first cementation cycle. The numbers of plotted peaks and rings are reduced for visualization purposes. |
 | JOURNAL OF SYNCHROTRON RADIATION |
ISSN: 1600-5775
 access