

 menu
|
|
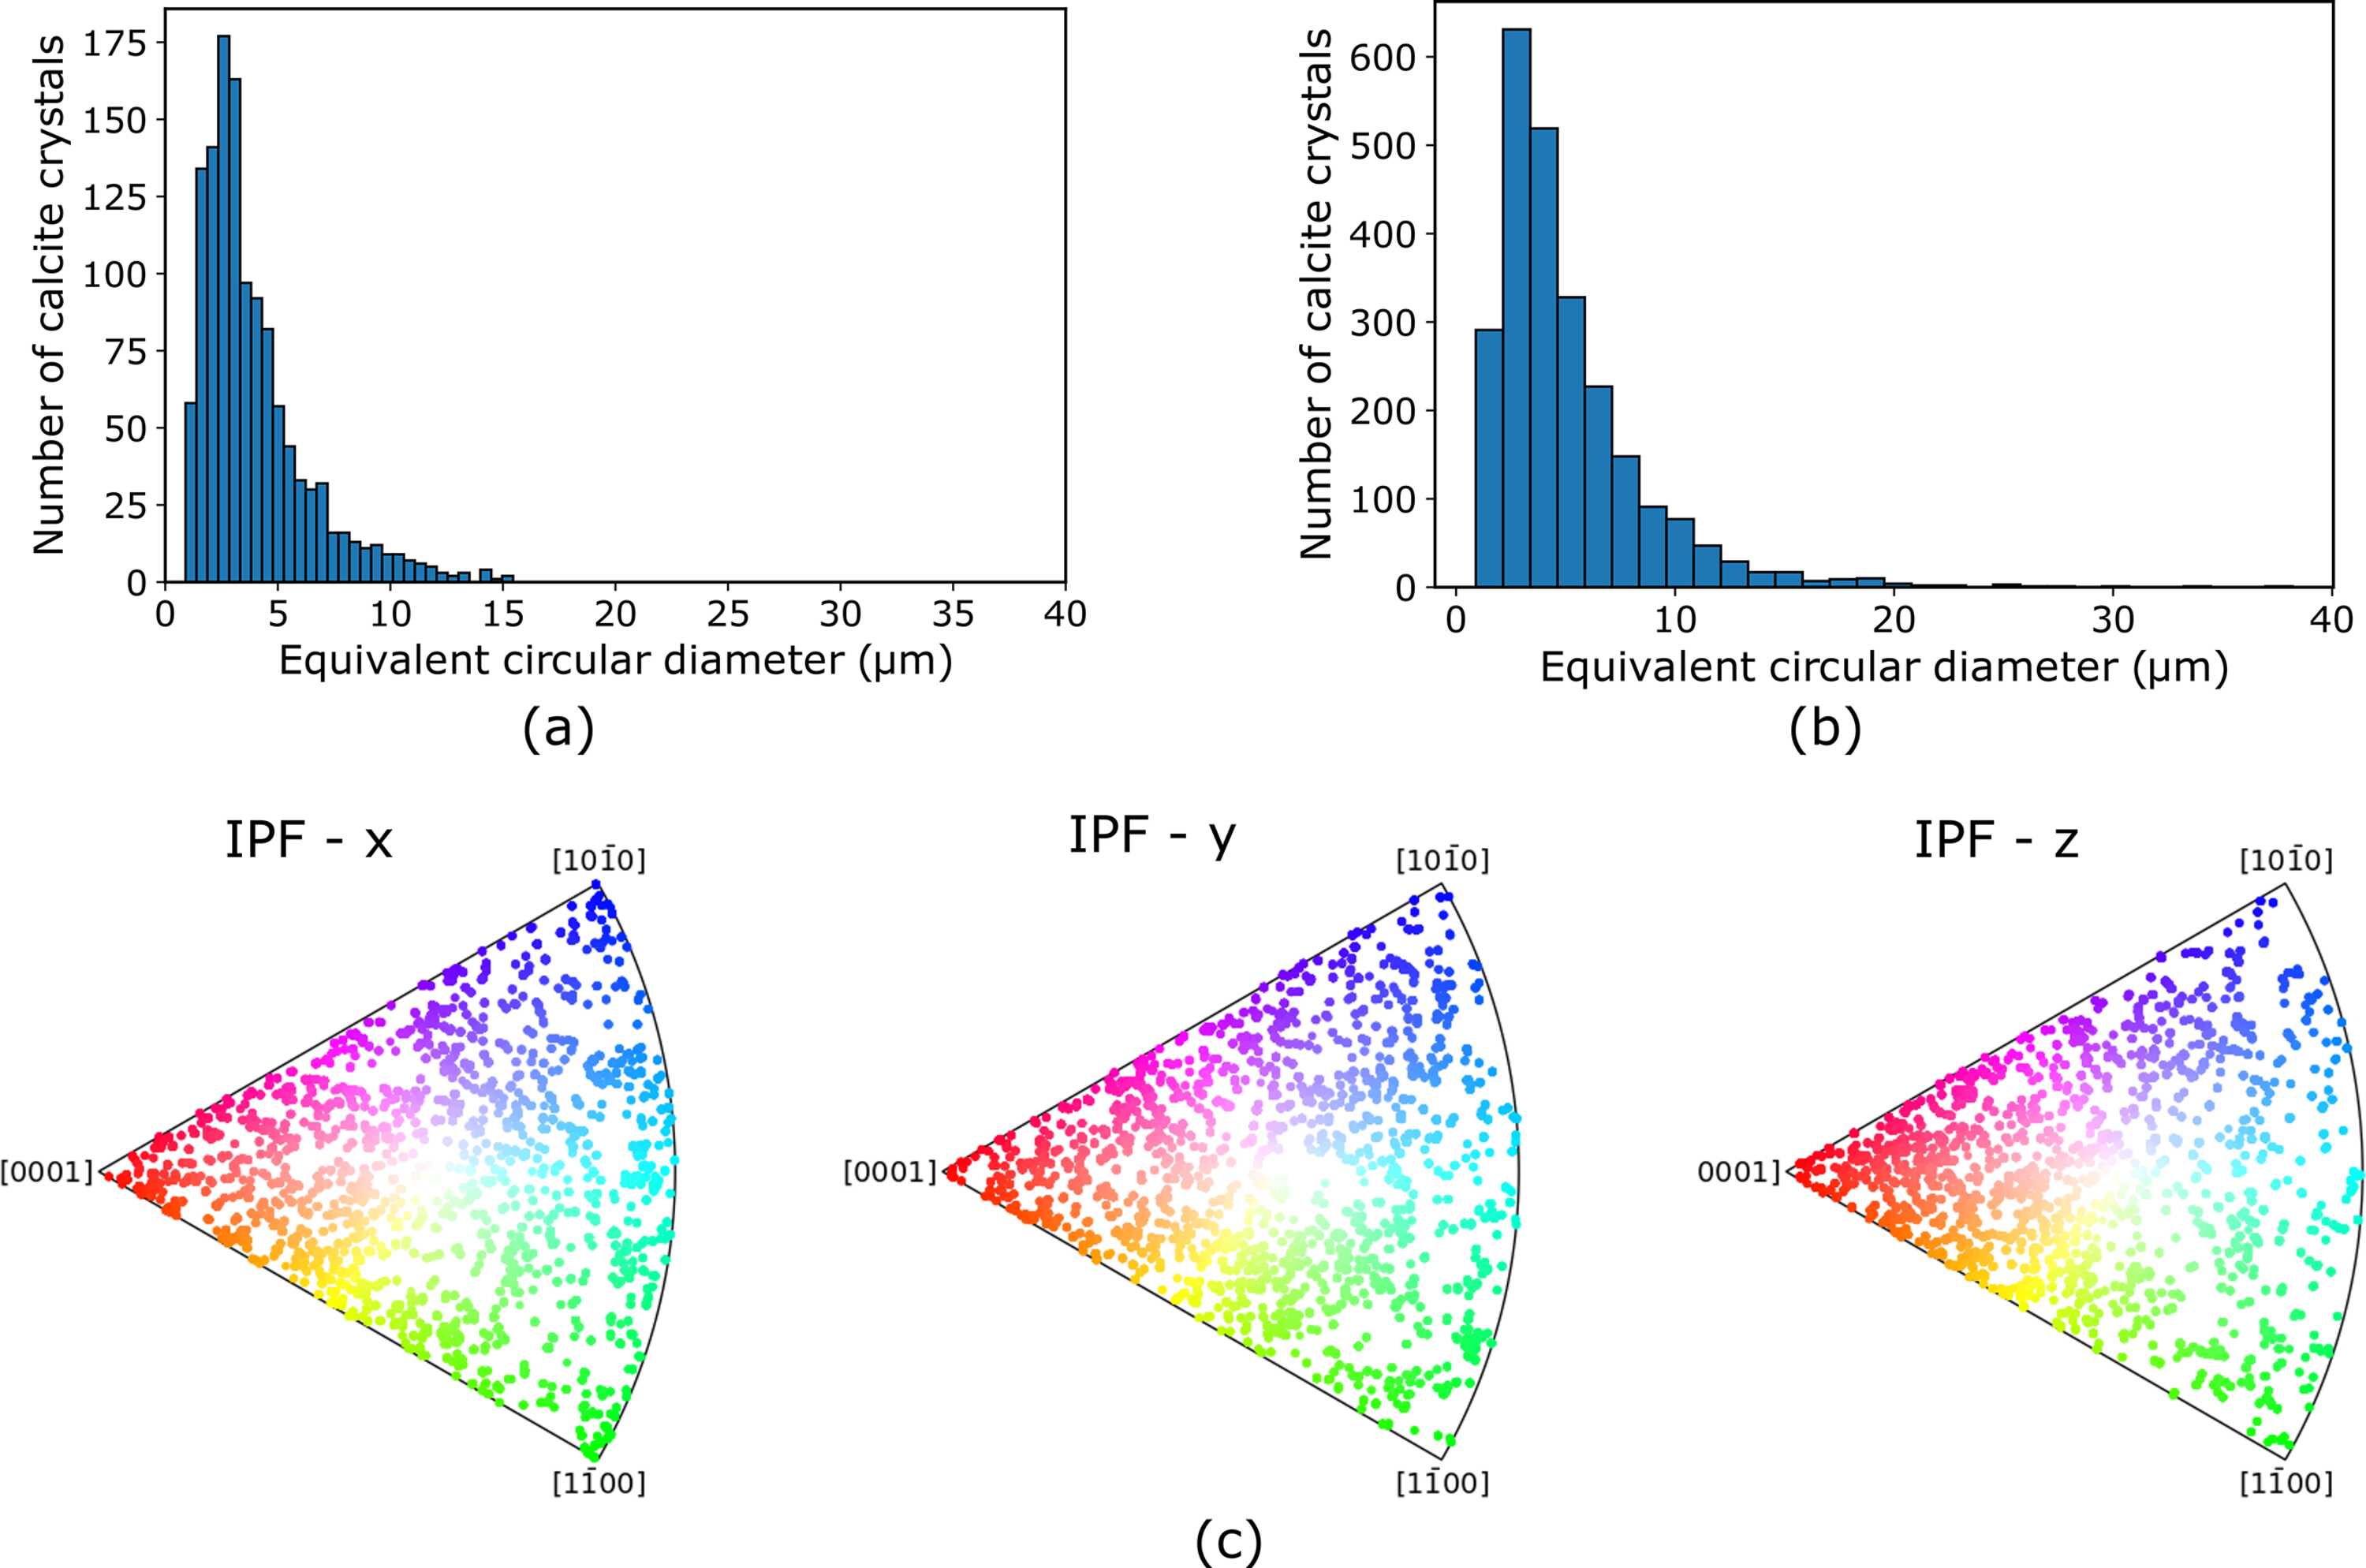
Figure 3
For the sample A, and for the middle layer of the scanned area of the contact, (a) histogram of the equivalent circular diameter, ECD, of the calcite crystals after one cycle of biocementation; (b) histogram of the ECD of the calcite crystals after three cycles of biocementation, and (c) the inverse pole figures, IPFs, along the x, y and z laboratory axes for one cycle of cementation. |
 | JOURNAL OF SYNCHROTRON RADIATION |
ISSN: 1600-5775
 access