

 menu
|
|
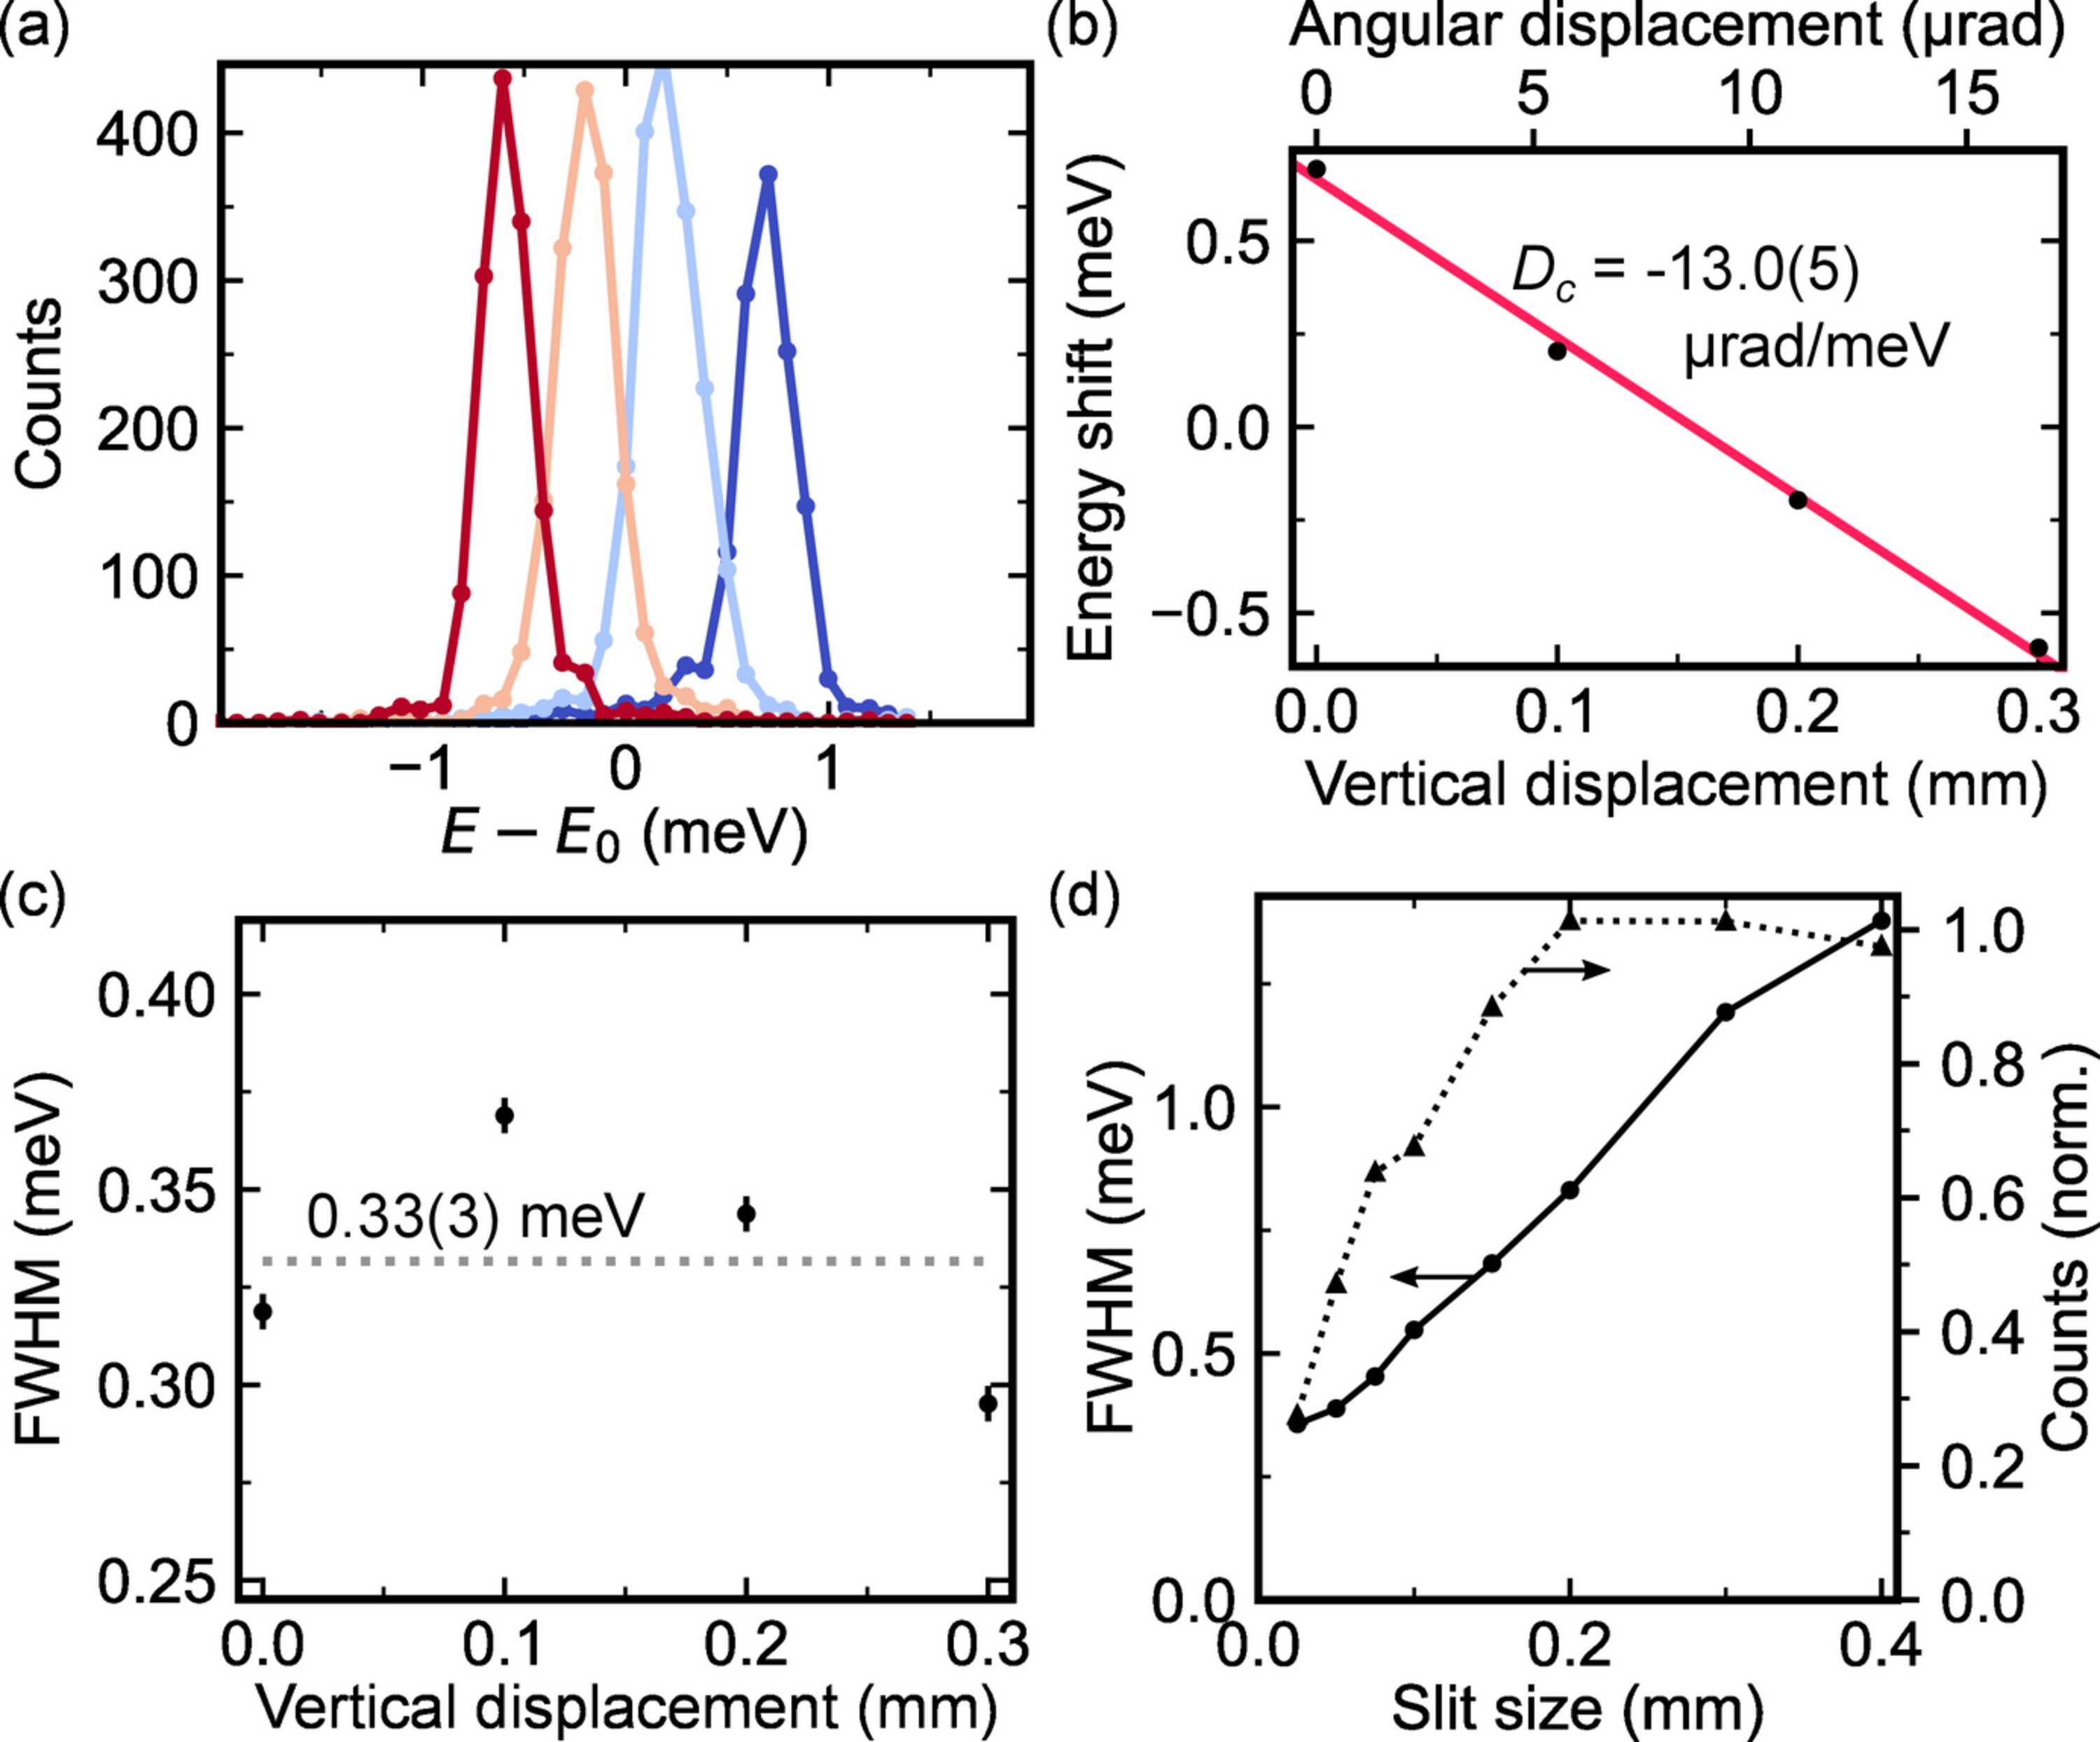
Figure 3
(a) In combination with lenses, the focal spots of different wavelengths within the instrumental function are angular displaced due to the dispersive nature of the HRM (here measured at four different spots by the vertical displacement at 18 m distance from the HRM using a 25 µm slit in front of the detector). (b) A linear regression (red line) of the energy shift as a function of the angular displacement reveals the combined dispersion Dc. (c) Derived FWHM at each of the four detector positions. The average FWHM is denoted by the dotted line. (d) FWHM (left axis, solid circles) and nuclear resonant counts (right axis, dashed triangles) as a function of the slit size in front of the detector. The resonant counts are normalized to the average maximum value with open slits. |
 | JOURNAL OF SYNCHROTRON RADIATION |
ISSN: 1600-5775
 access