

 menu
|
|
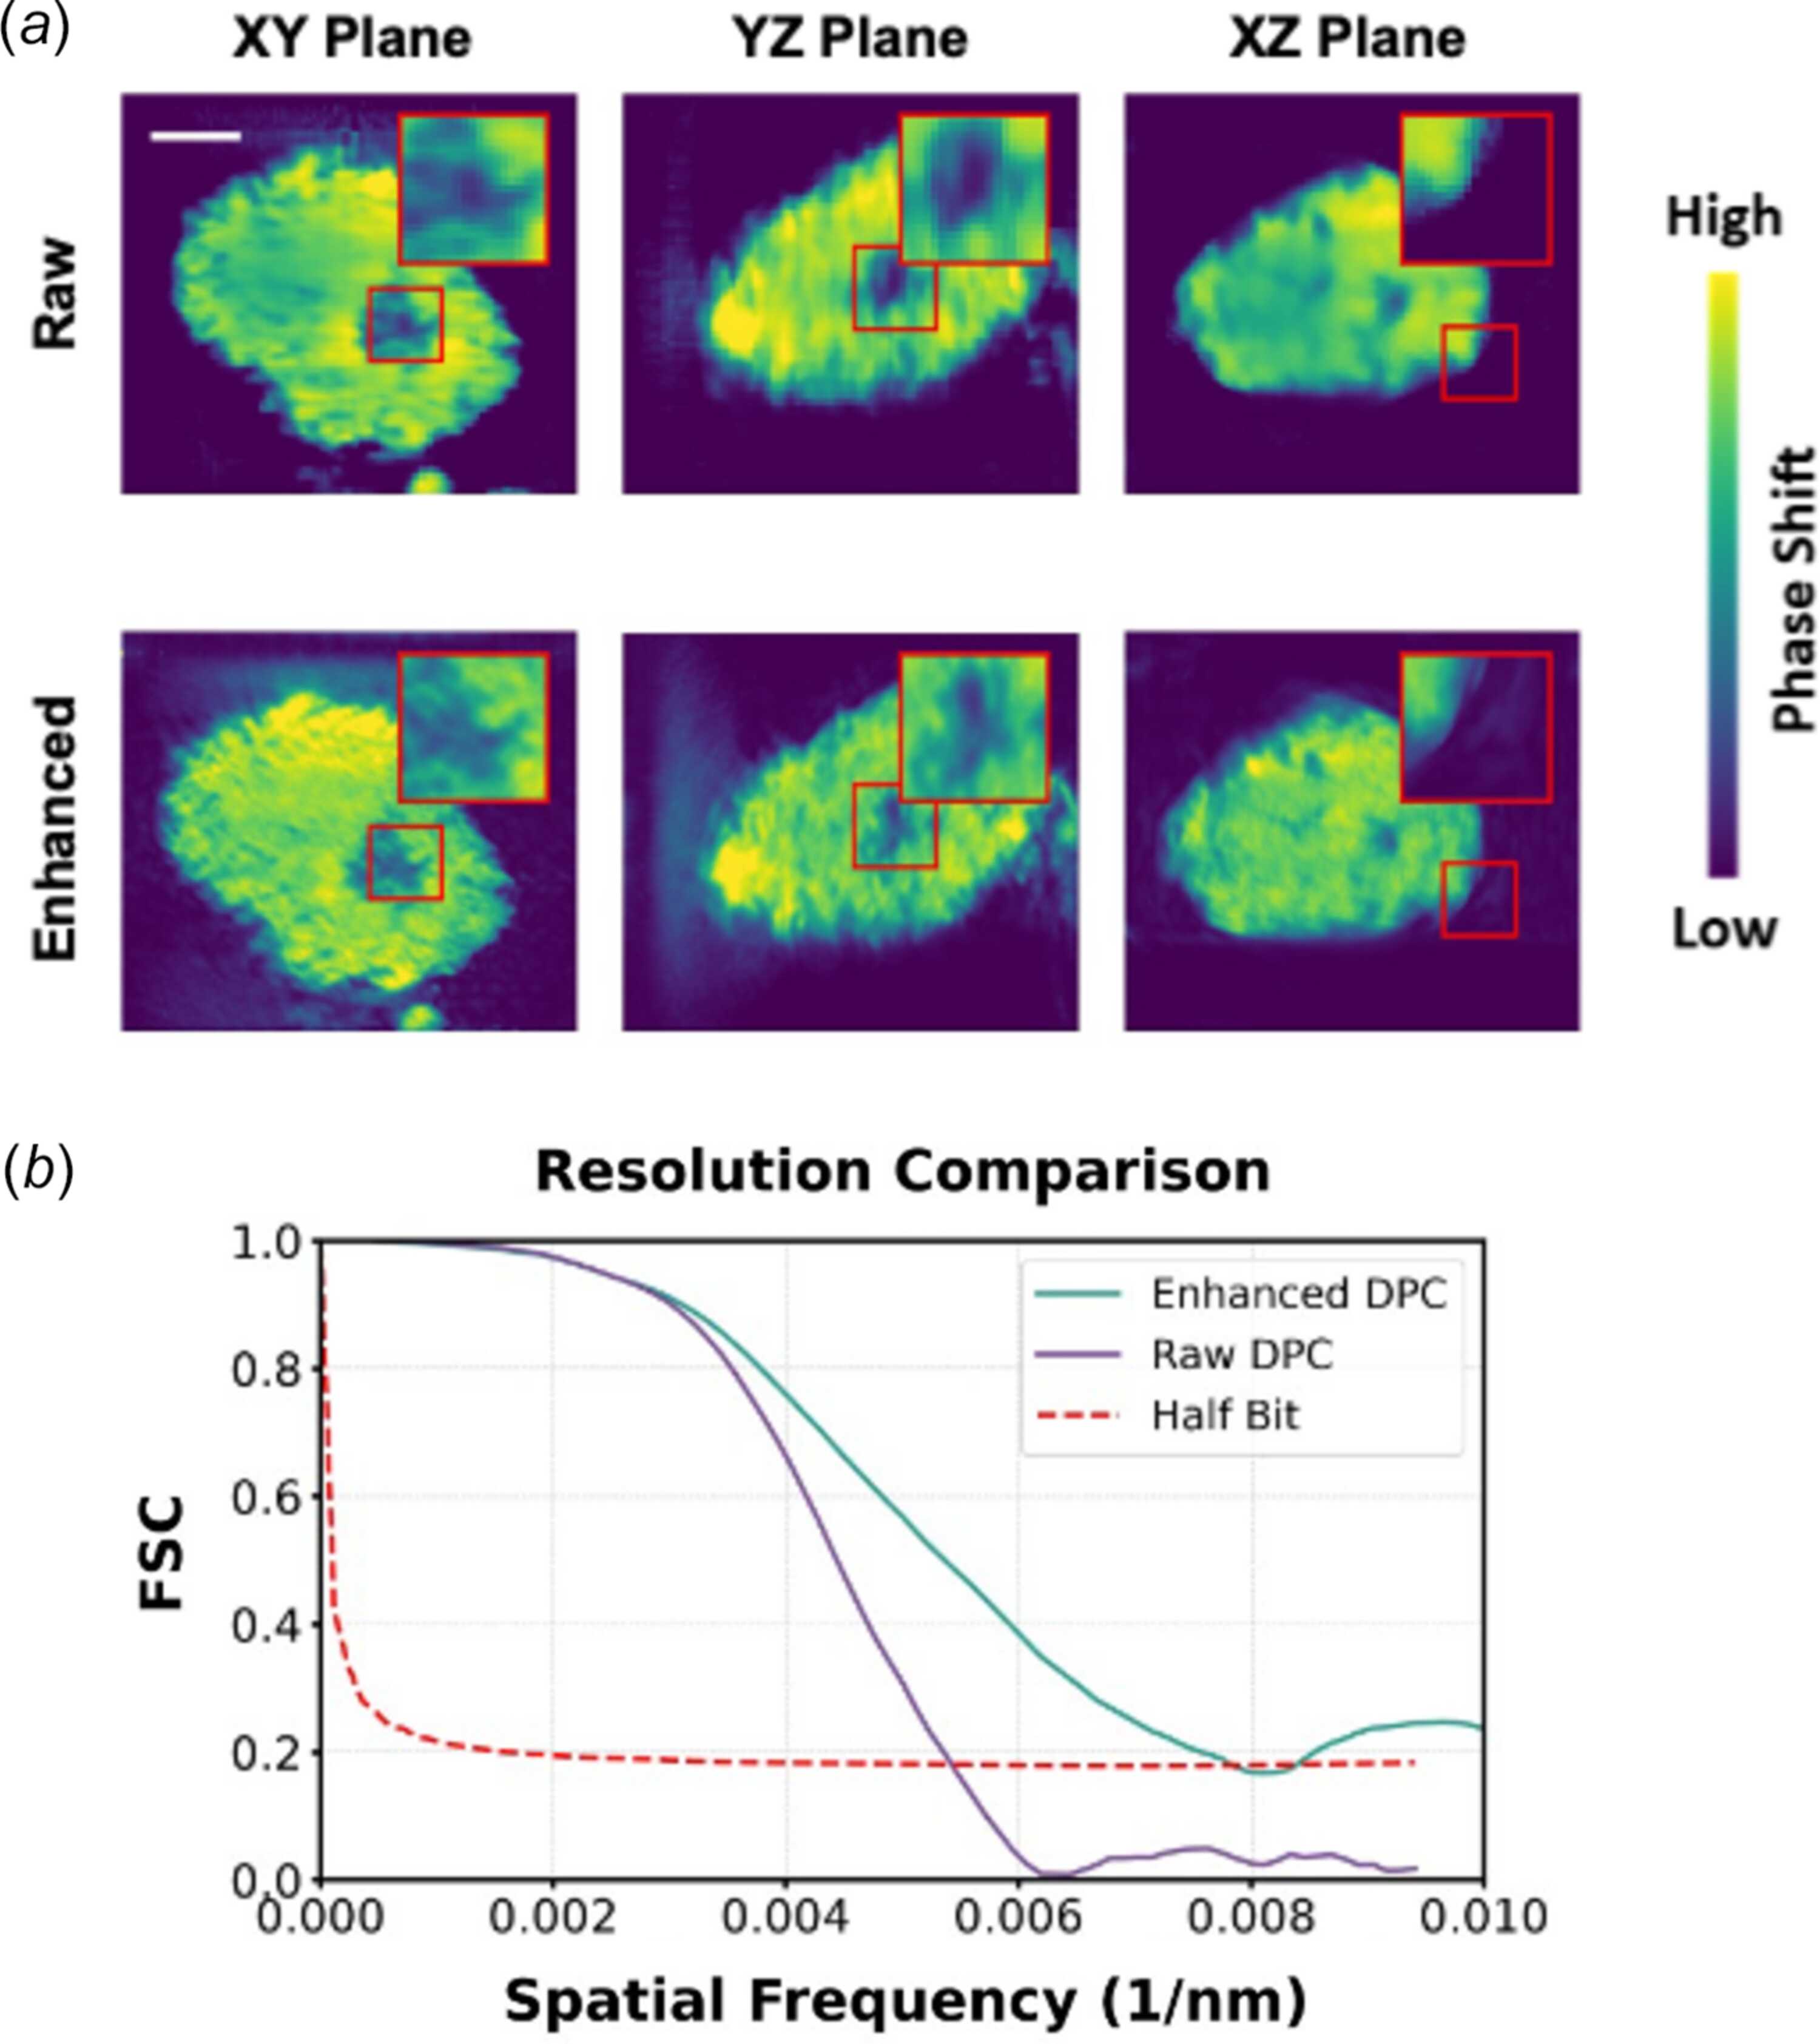
Figure 5
Comparison of the raw and enhanced 3D DPC reconstructions. (a) Orthogonal XY, YZ, and XZ slices for the raw (top) and enhanced (bottom) reconstructions, with magnified insets marked by red boxes. Scale bar: 2 µm. (b) Fourier shell correlation (FSC) curves and the half-bit threshold; the intersections give resolutions of 186 nm for the raw data and 128 nm for the enhanced data. |
 | JOURNAL OF SYNCHROTRON RADIATION |
ISSN: 1600-5775
 access