

 menu
|
|
Figure 1
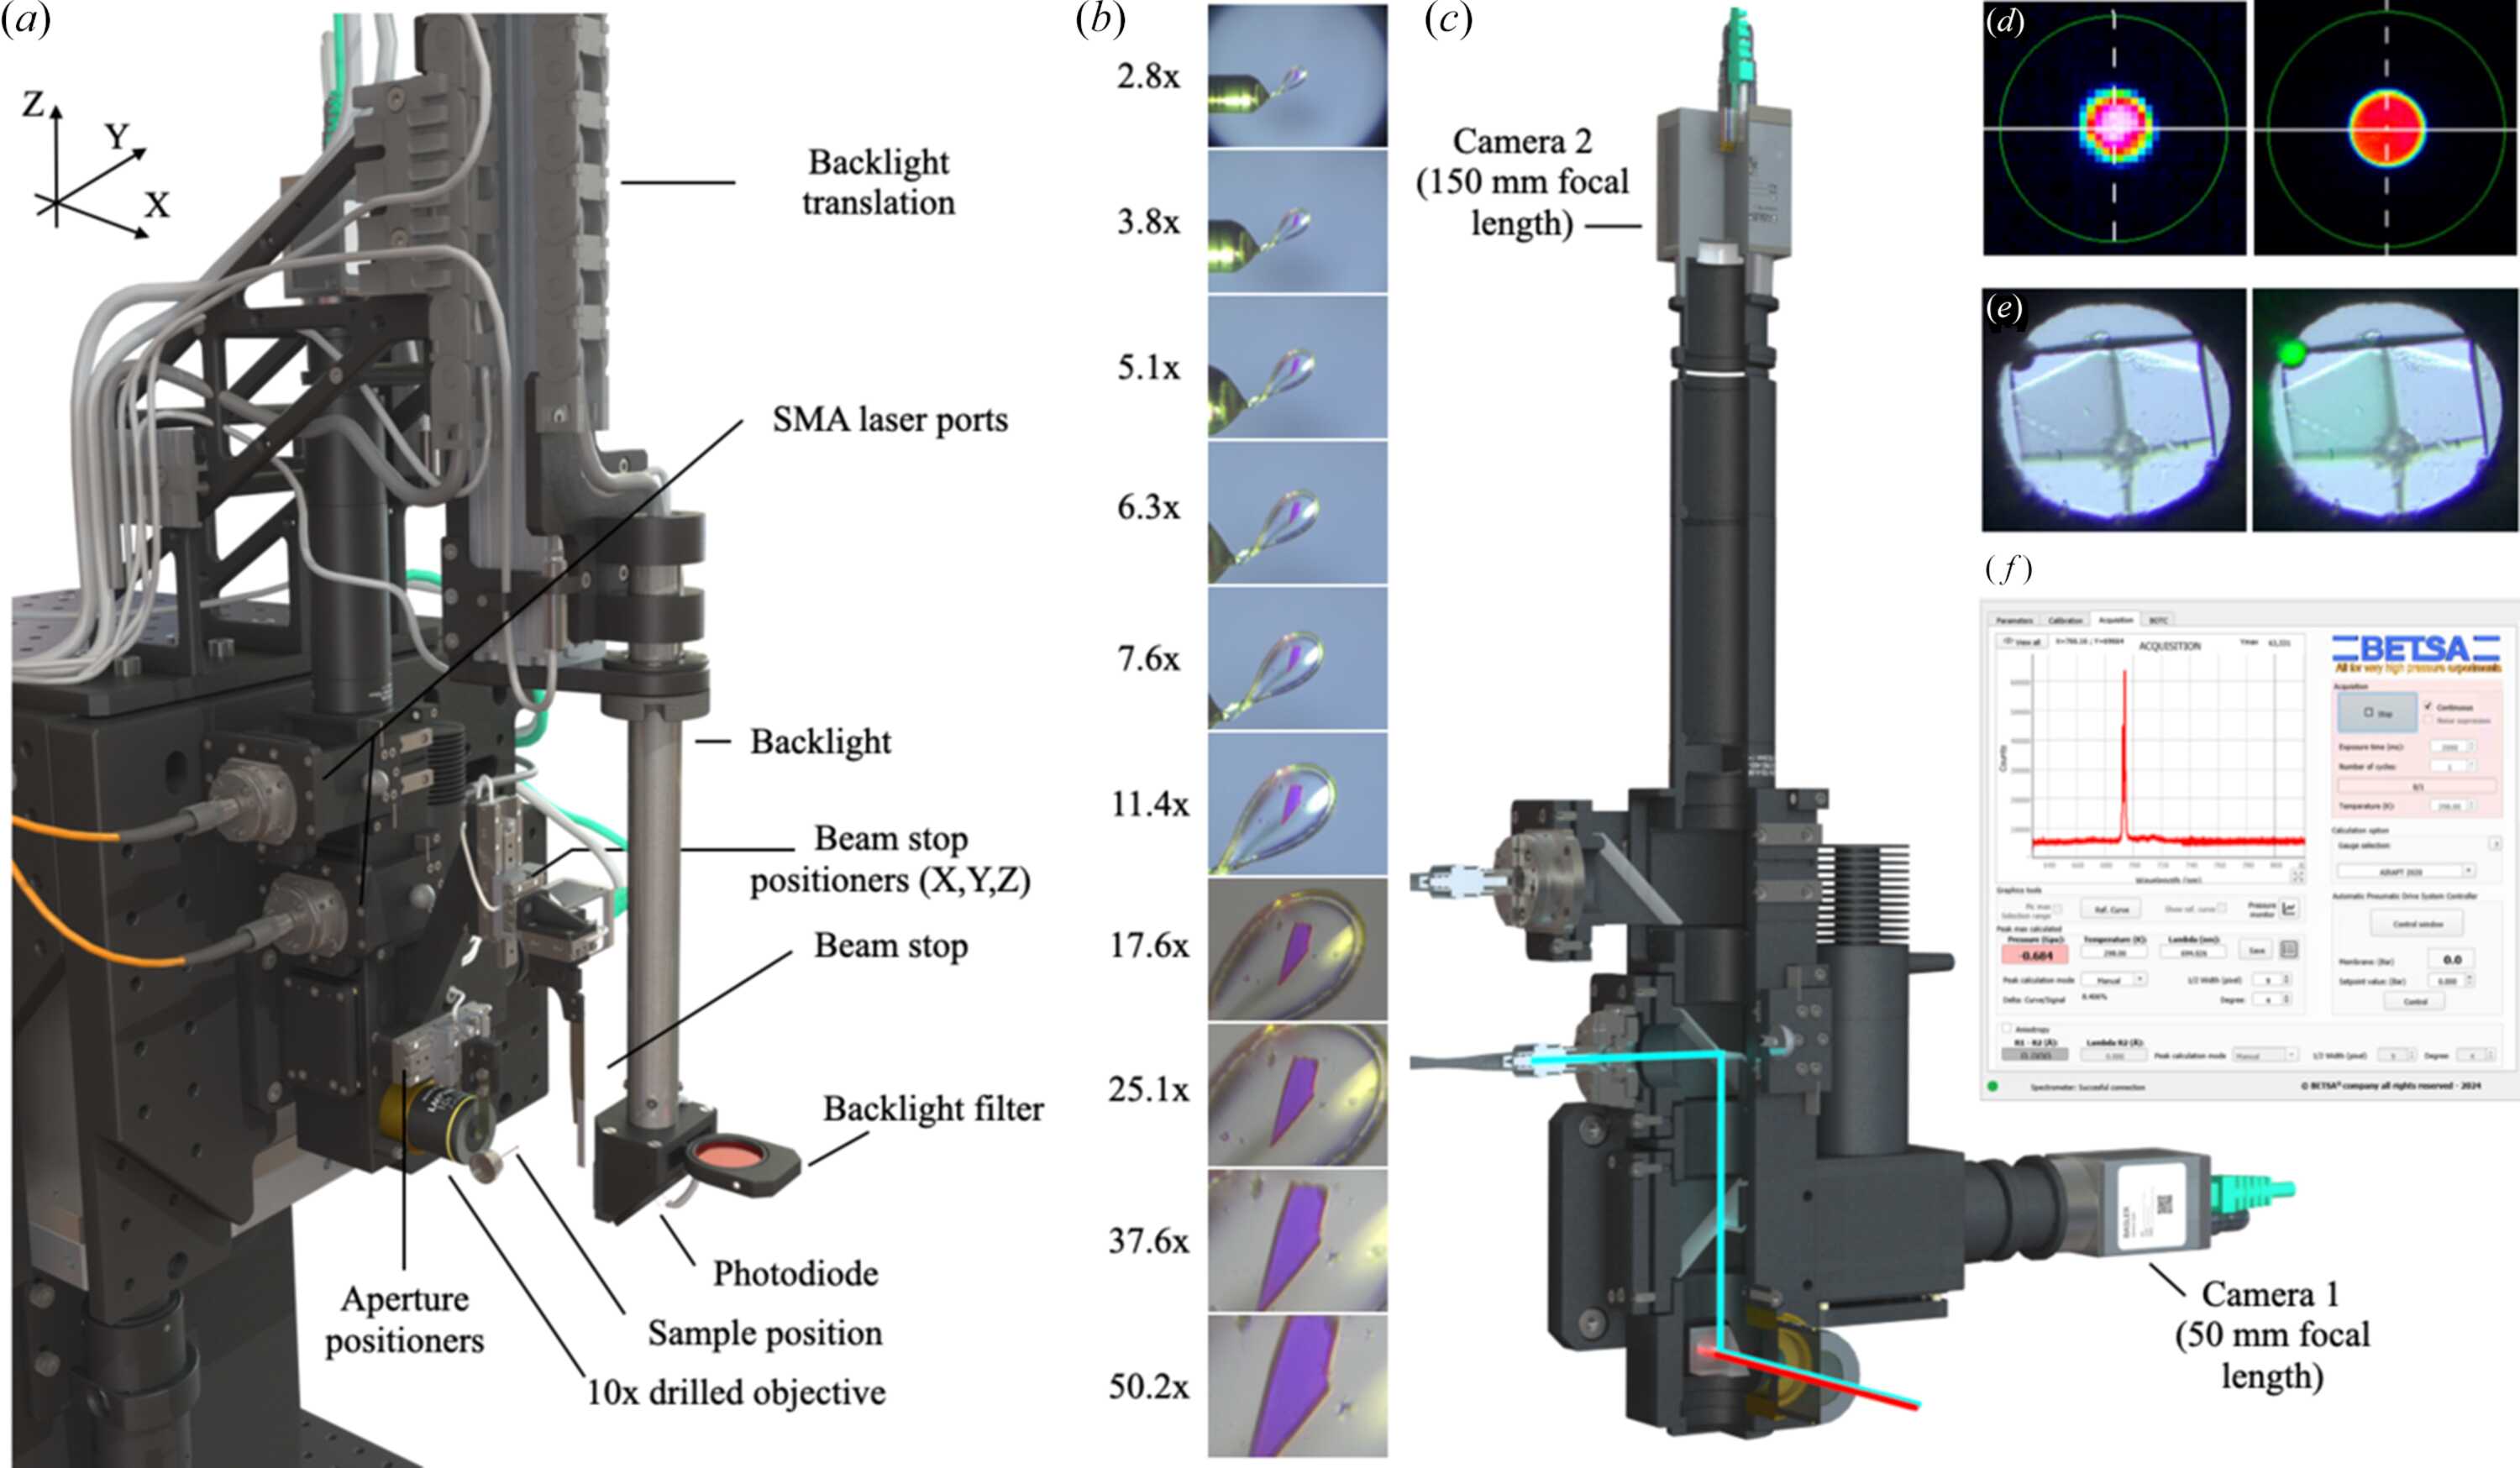
(a) Overview of the dual-magnification on-axis microscope installed on the sample environment of BM07. (b) Representative views of a mounted sample recorded at different magnification levels, from 2.8× to 50.2×, demonstrating the transition from low to high magnification. (c) Cutaway view of the on-axis microscope with the optical path partially exposed, showing the laser-injection path through the microscope optics (cyan beam) and the X-ray beam (red beam) passing along the optical axis through the central apertures of the prism and objective. The laser beam is redirected towards the sample by a drilled reflective prism located behind the objective; its central aperture allows passage of the X-ray beam. (d) Laser-beam profile 50 µm (left) and 200 µm (right) measured at the sample position using a DataRay CMOS beam profiler, illustrating the size and shape of the excitation spot delivered through the SMA-coupled optical path at the sample position. (e) View inside the DAC showing a lysozyme crystal in the DAC cavity (400 µm in diameter) and the 25 µm excitation laser spot at 532 nm positioned on a ruby chip (right). (f) Graphical user interface of the PRL 4000 software (BETSA, France) used for ruby-fluorescence analysis, showing the fluorescence emission spectrum collected from the ruby and the corresponding pressure determination. |
 | JOURNAL OF SYNCHROTRON RADIATION |
ISSN: 1600-5775
 access