

 menu
|
|
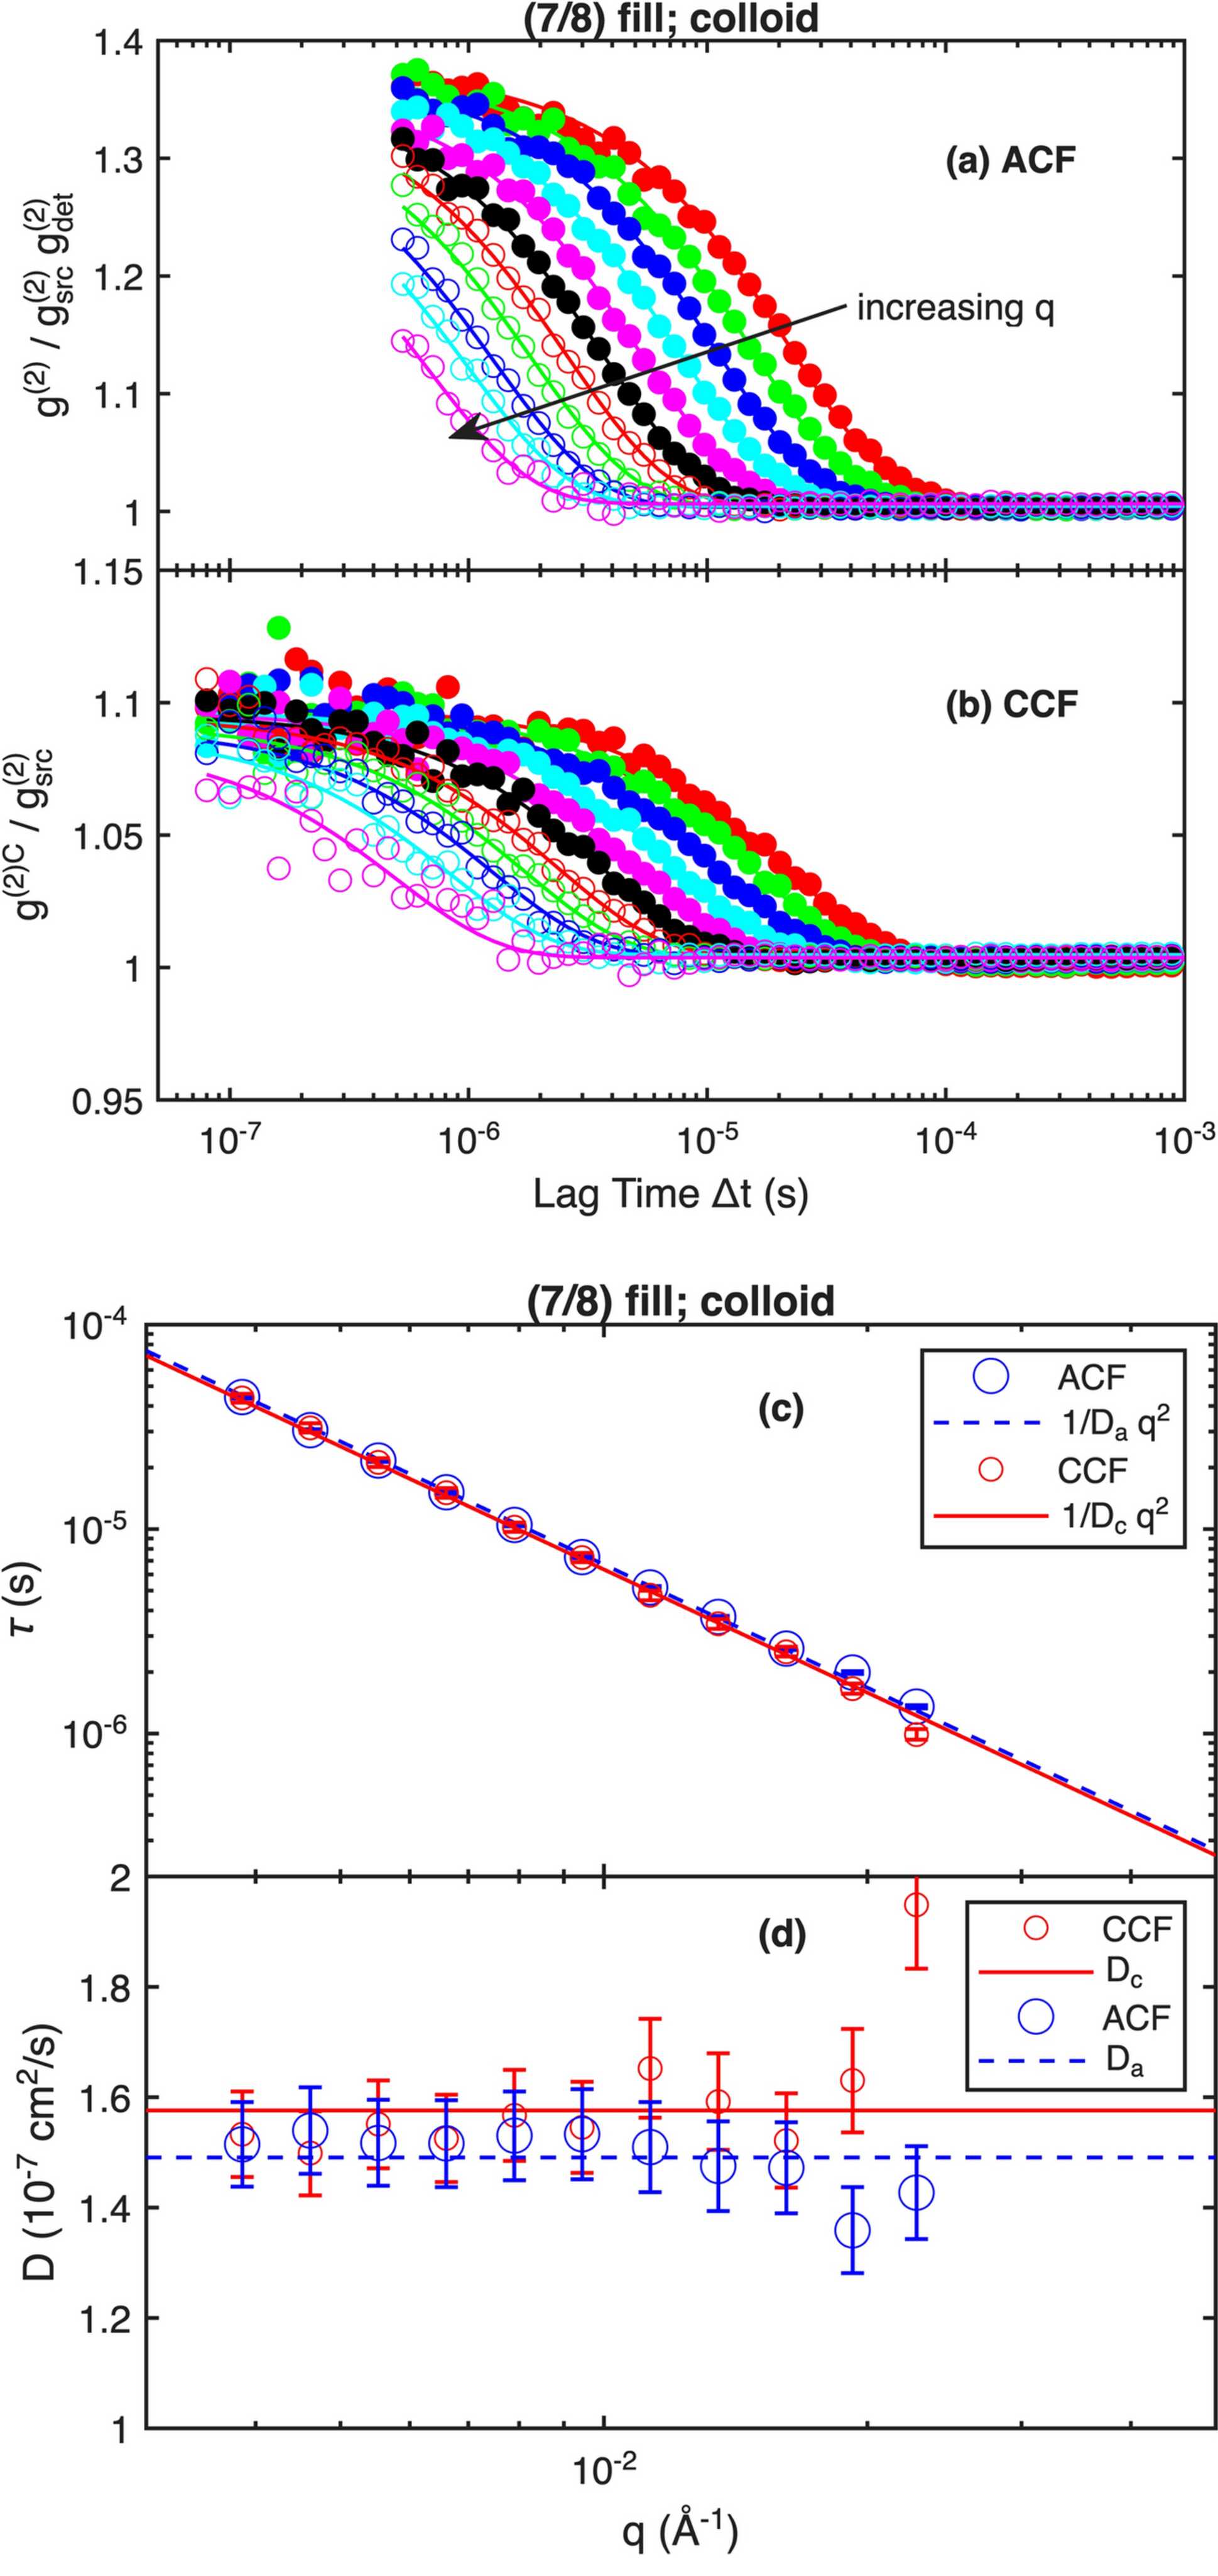
Figure 12
Curves show fits of equation (15)  to the normalized g(2) at each wavenumber for the colloid obtained using the (7/8) fill pattern, for (a) ACF and (b) CCF data (symbols). (c) Symbols show relaxation times as a function of q from the fits to ACF and CCF. Lines show best fits of nanoparticle diffusivity. (d) Data from (c) replotted as D = (τq2)−1 versus q. |
 | JOURNAL OF SYNCHROTRON RADIATION |
ISSN: 1600-5775
 access