

 menu
|
|
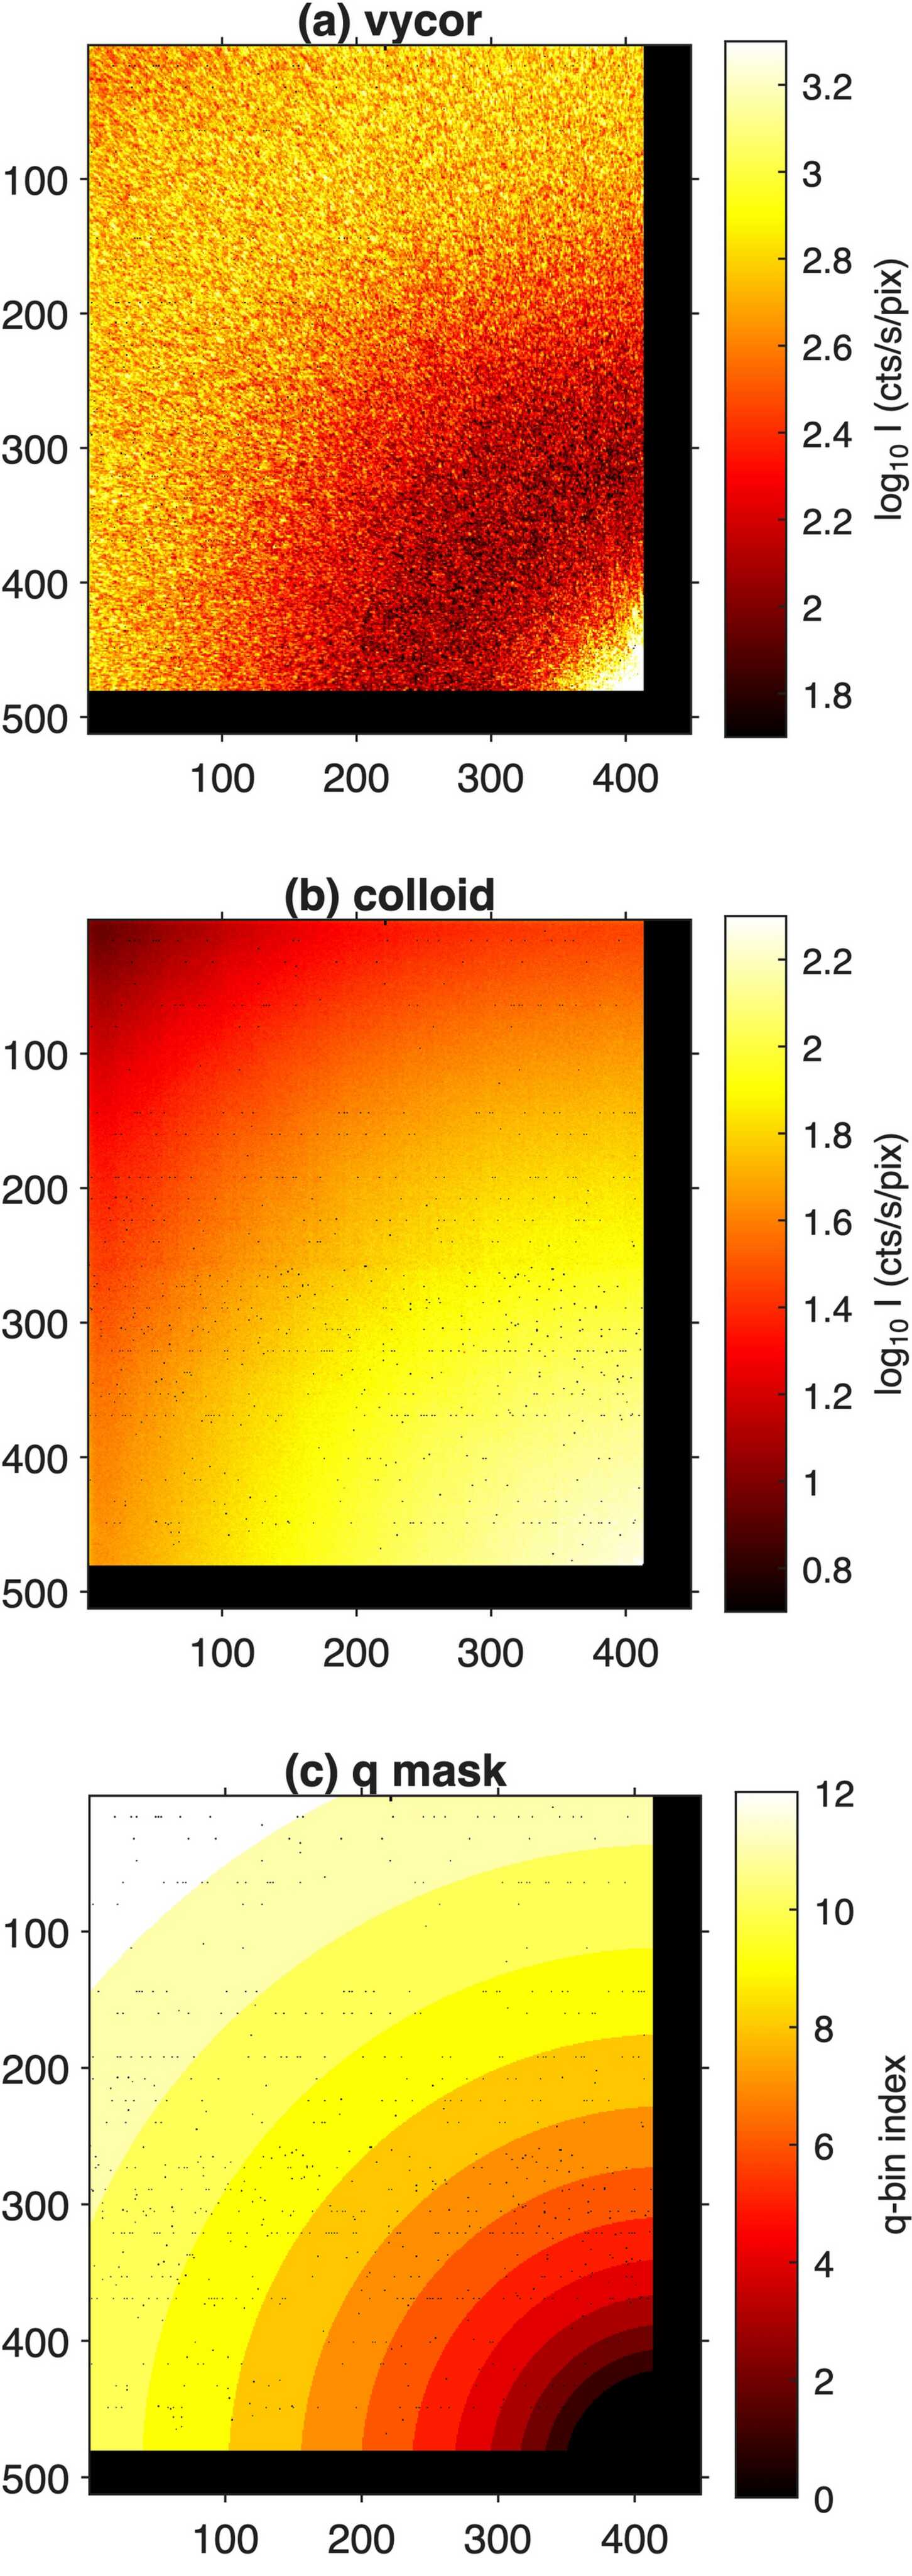
Figure 2
Time-averaged scattering patterns from (a) Vycor and (b) colloid samples, for unattenuated incident beam. (c) Mask used to define annular q ranges for g(2). All plotted in pixel coordinates. The direct beam is centered at pixel (425, 498). |
 | JOURNAL OF SYNCHROTRON RADIATION |
ISSN: 1600-5775
 access