

 menu
|
|
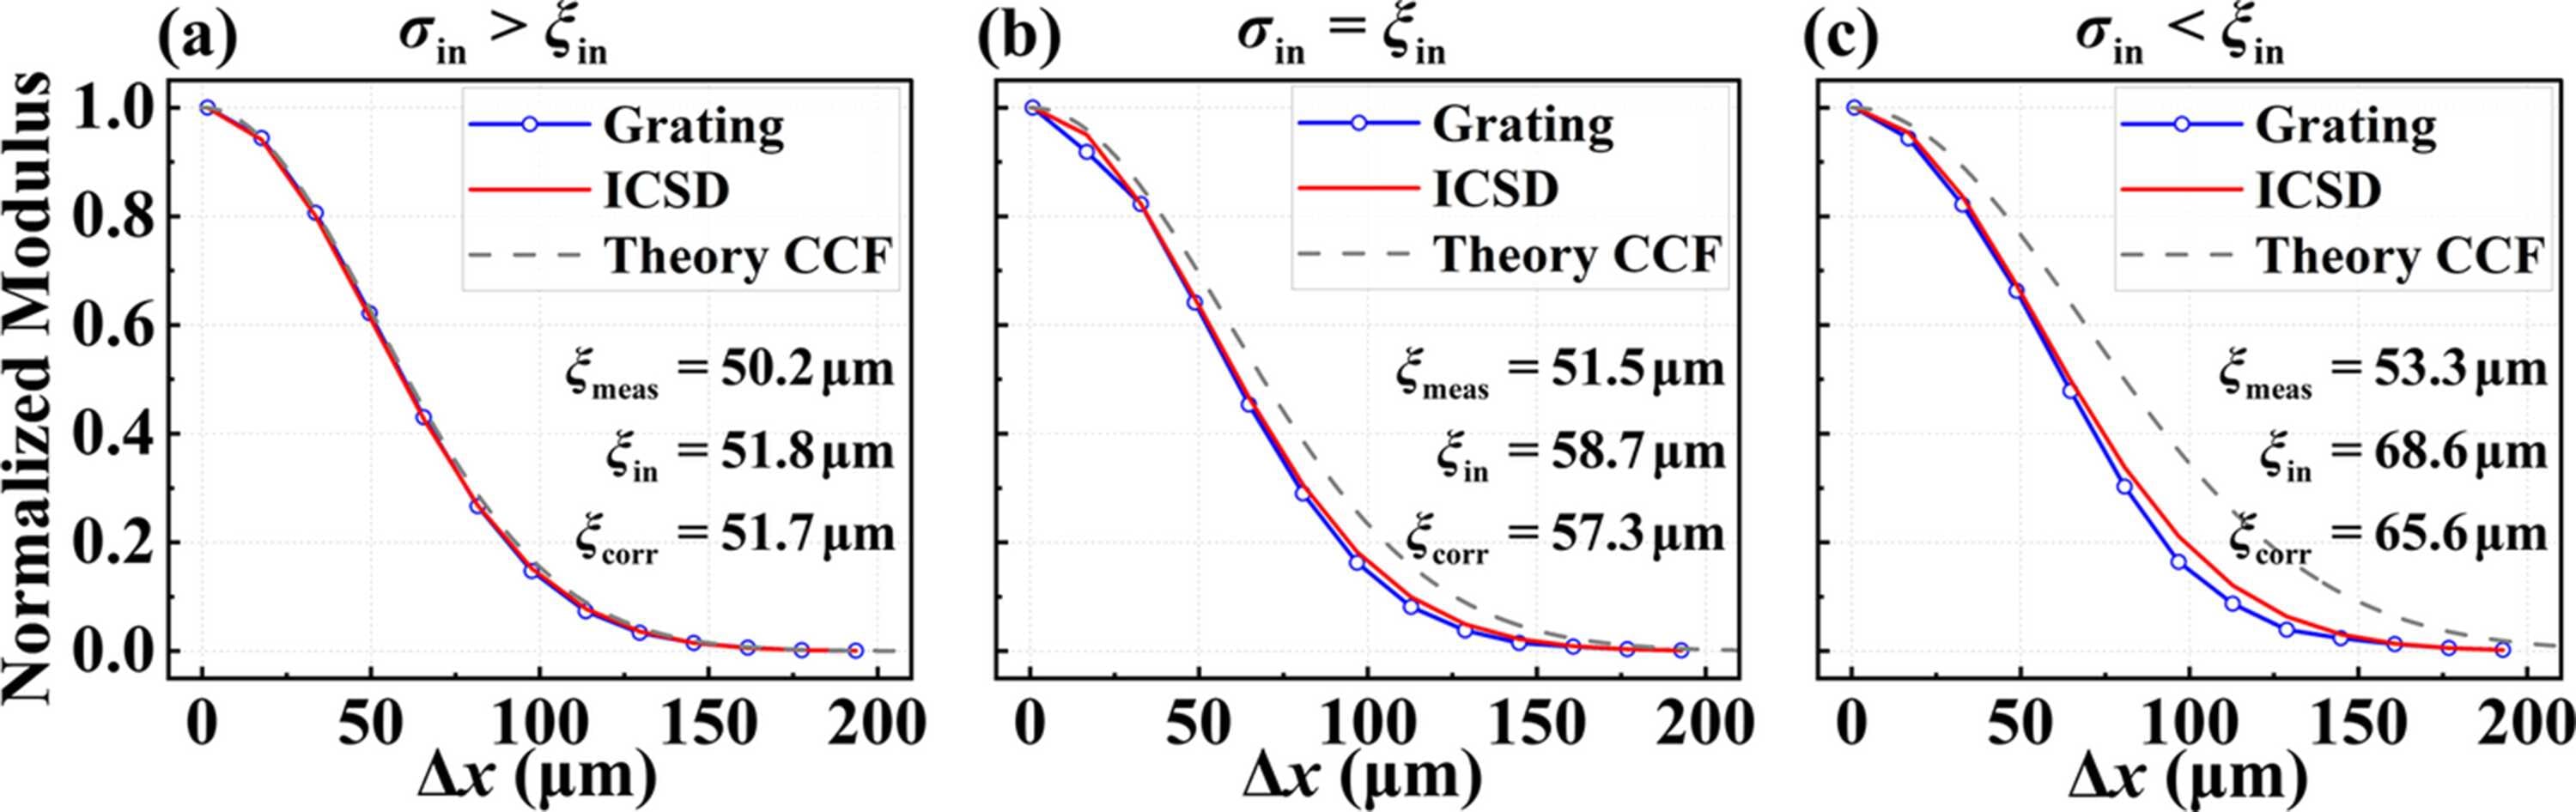
Figure 4
Validation of the ICSD under different conditions at the grating plane: (a) σin > ξin, (b) σin = ξin, and (c) σin < ξin. The blue open circles represent XGI-measured visibility curves from simulations. The red solid lines denote analytical predictions based on the ICSD. The gray dashed lines show the theoretical CCF for reference. The extracted visibility width ξmeas, the theoretical input coherence length ξin, and the corrected coherence length ξcorr calculated via equation (12)  are annotated. |
 | JOURNAL OF SYNCHROTRON RADIATION |
ISSN: 1600-5775
 access