

 menu
|
|
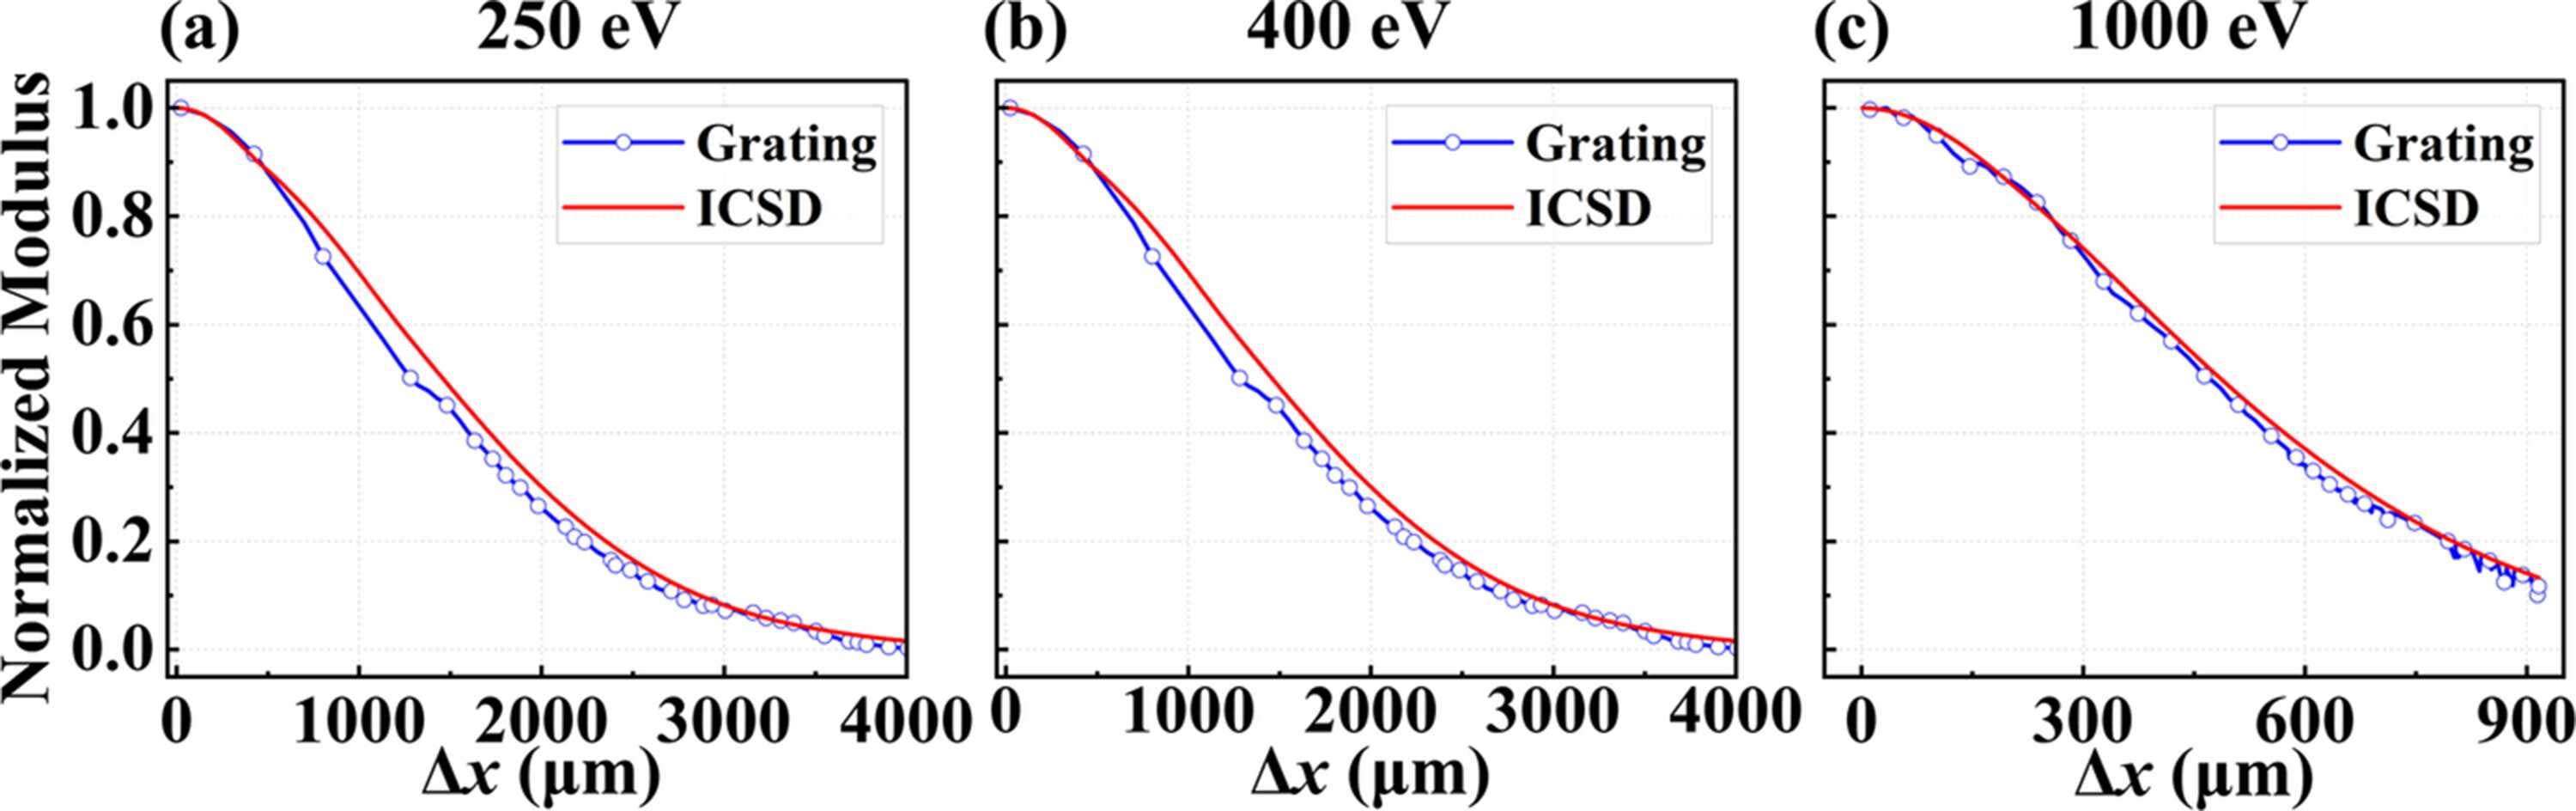
Figure 5
Validation of the ICSD using real SR sources. Panels (a), (b), and (c) show visibility curves of HALF corresponding to photon energies of 250 eV, 400 eV, and 1000 eV, respectively. The blue open circles represent the visibility extracted from the full wave optical simulations of the XGI. The red solid lines denote the normalized ICSD for each photon energy. |
 | JOURNAL OF SYNCHROTRON RADIATION |
ISSN: 1600-5775
 access