

 menu
|
|
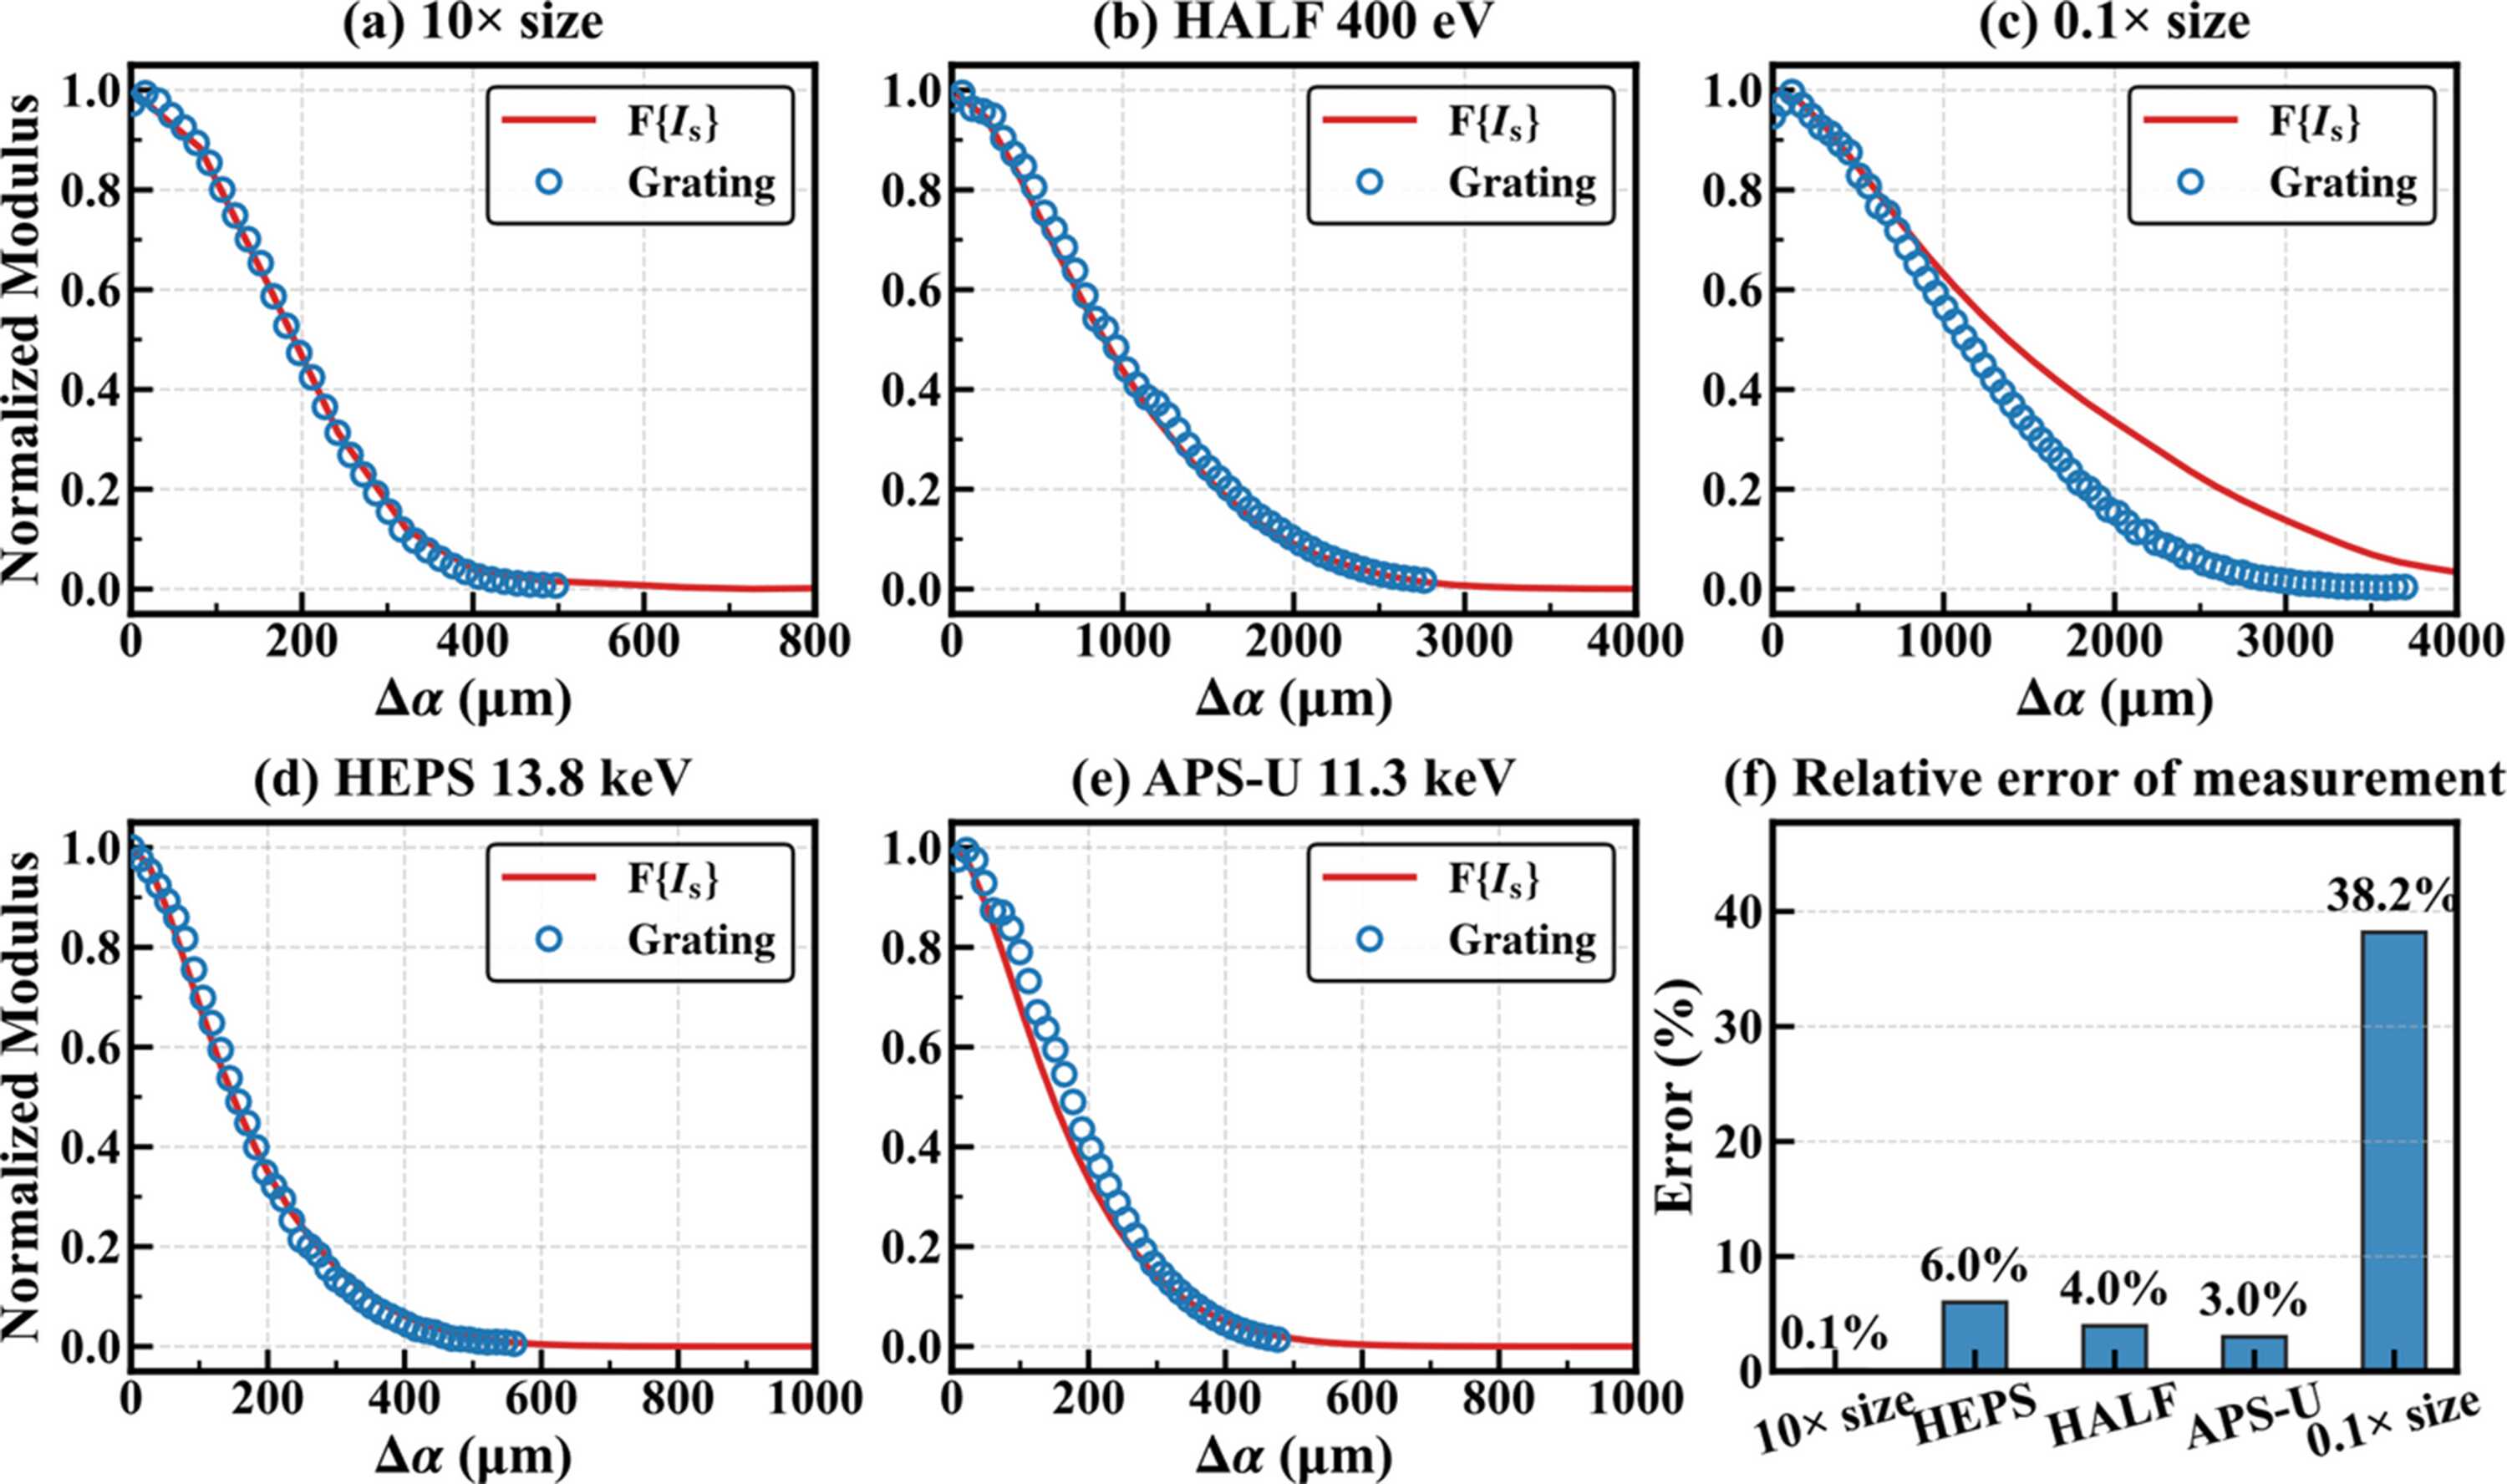
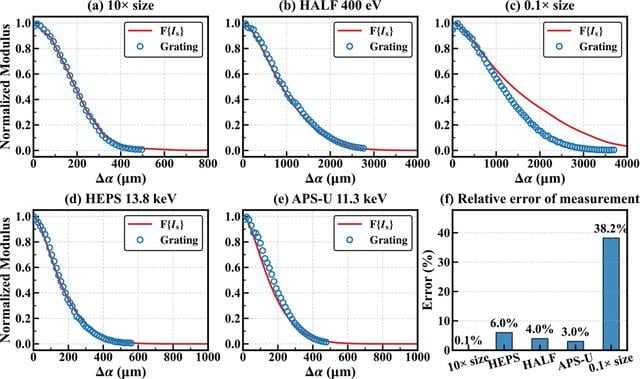
Figure 6
Comparison between the simulated XGI visibility curves (blue open circles) and the modulus of the theoretical Fourier transform of the actual source intensity (red solid lines) for (a) 10×-size source, (b) HALF at 400 eV, (c) 0.1×-size source, (d) HEPS at 13.8 keV, and (e) APS-U at 11.3 keV. (f) The relative error of the source size measurement (Δσ/σ) using equation (19)  for each corresponding case. |
 | JOURNAL OF SYNCHROTRON RADIATION |
ISSN: 1600-5775
 access