

 menu
|
|
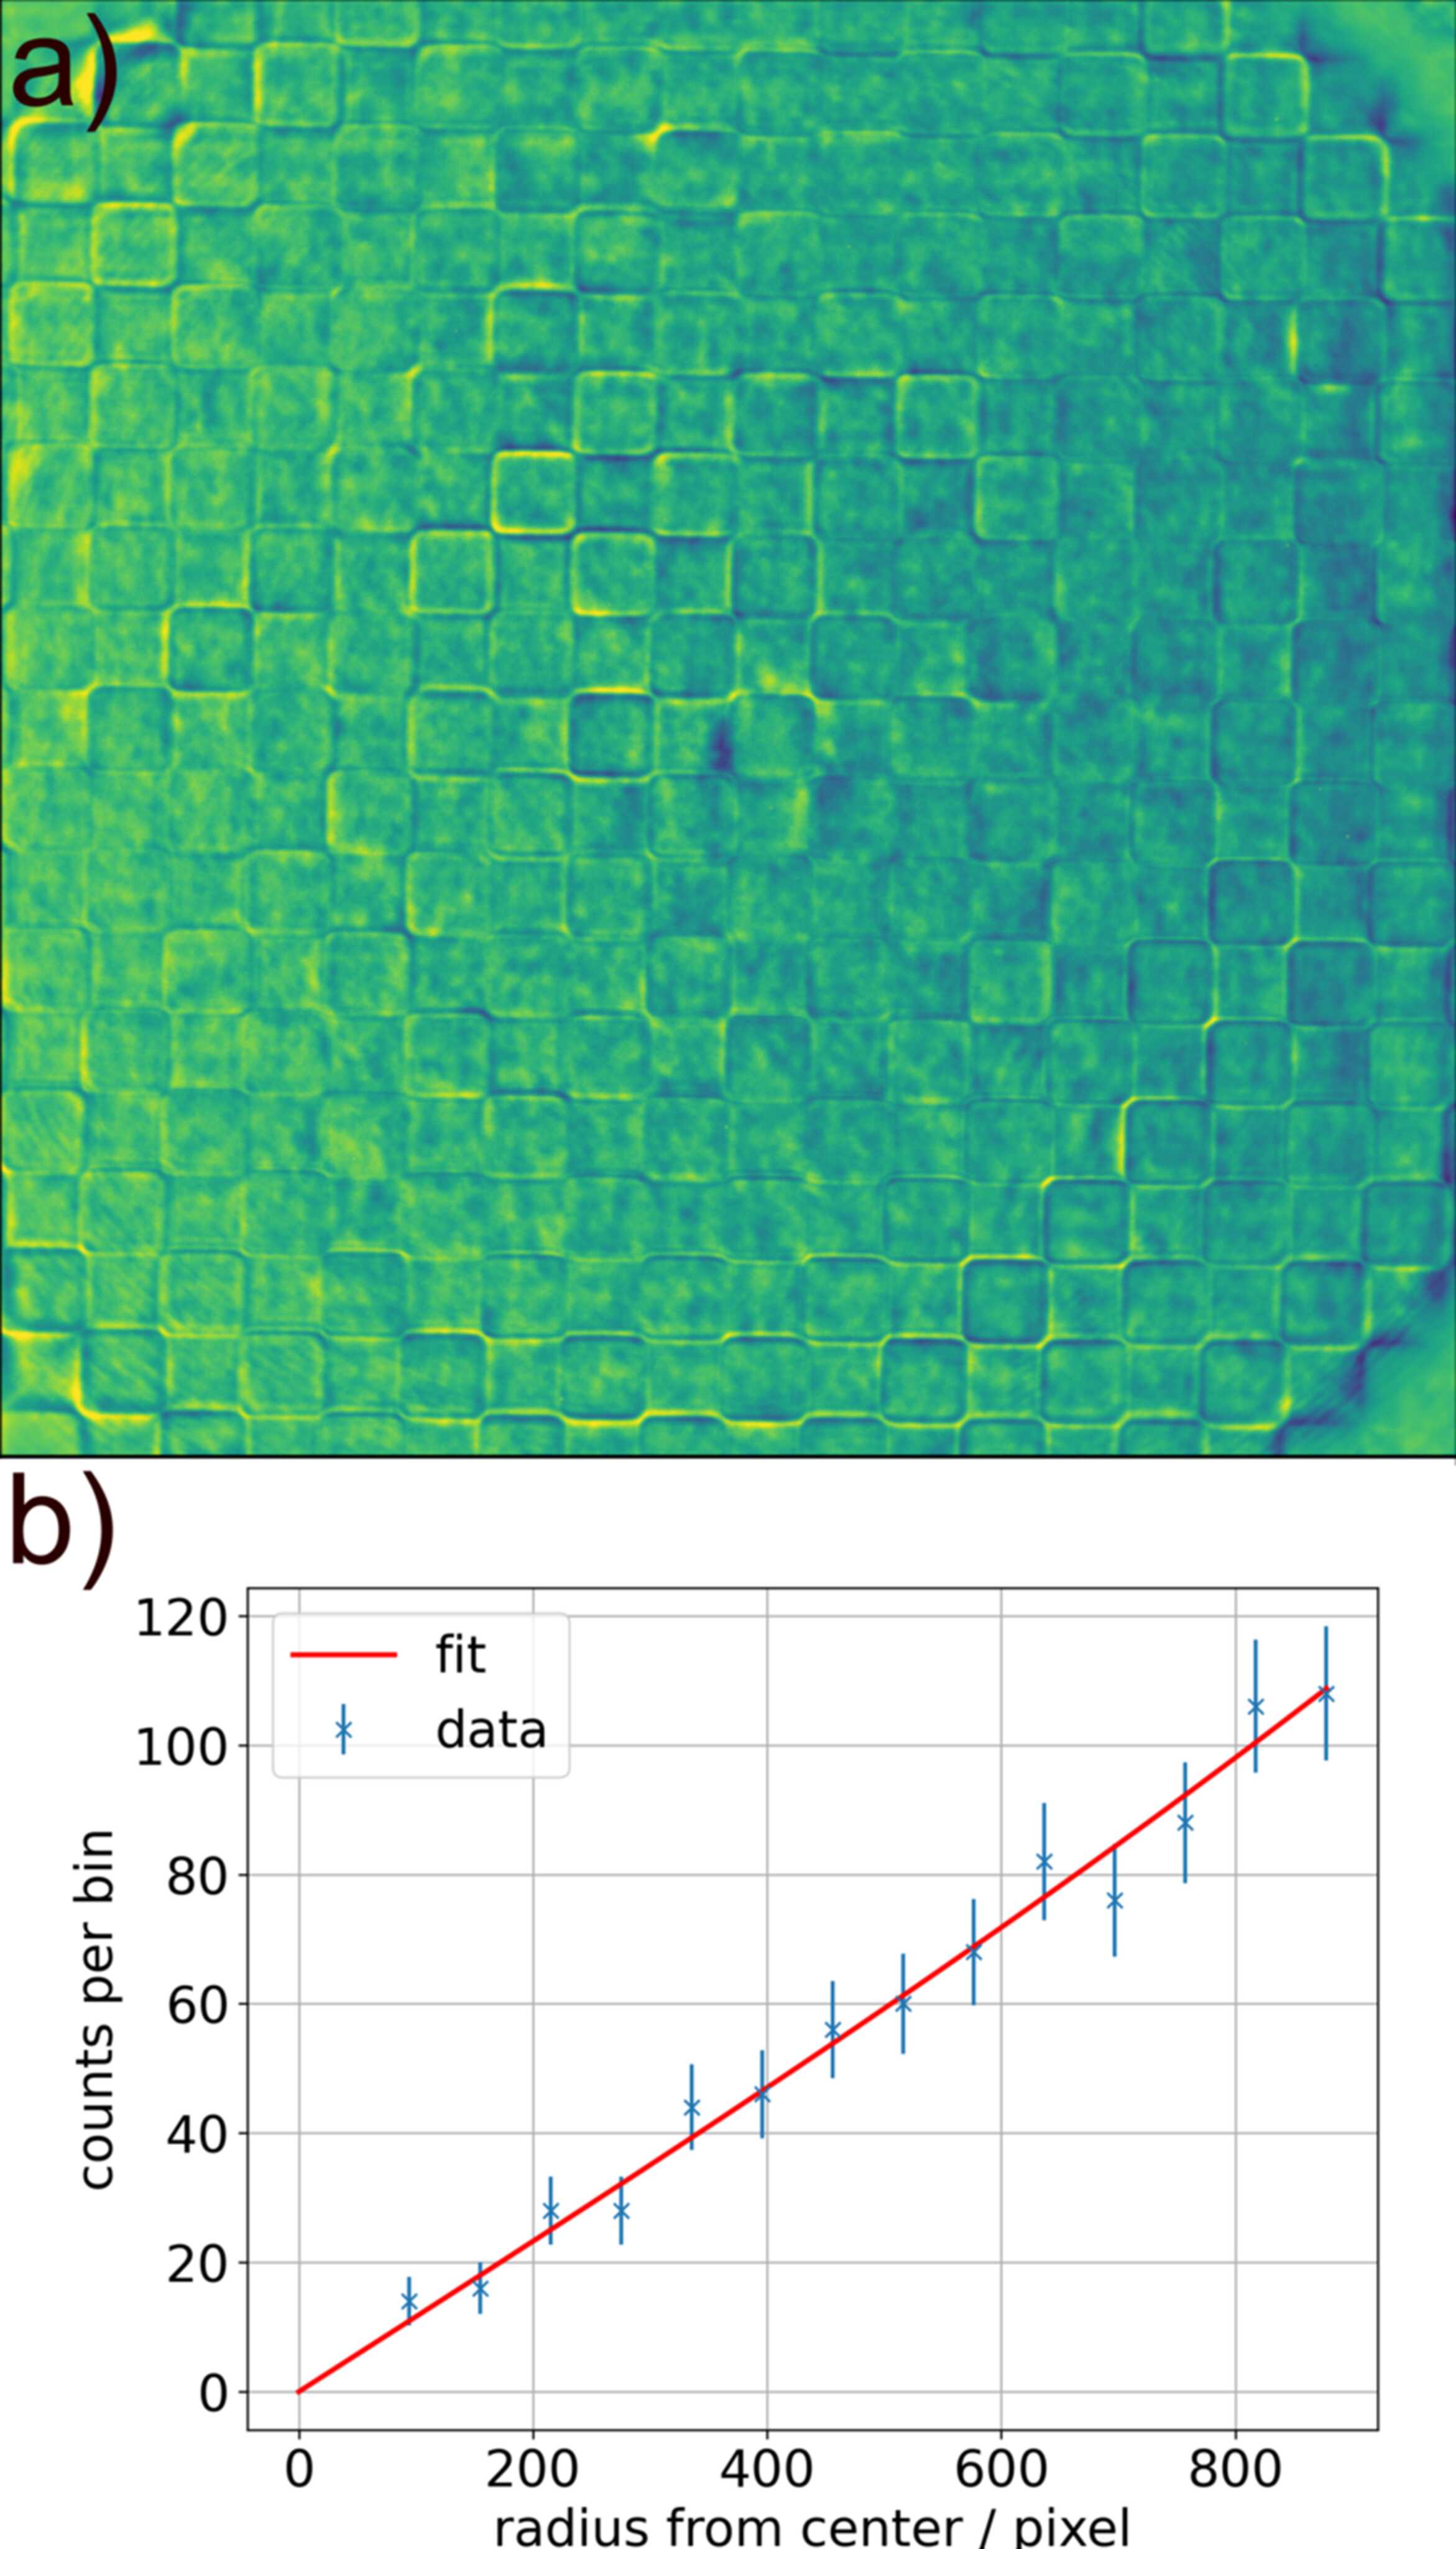
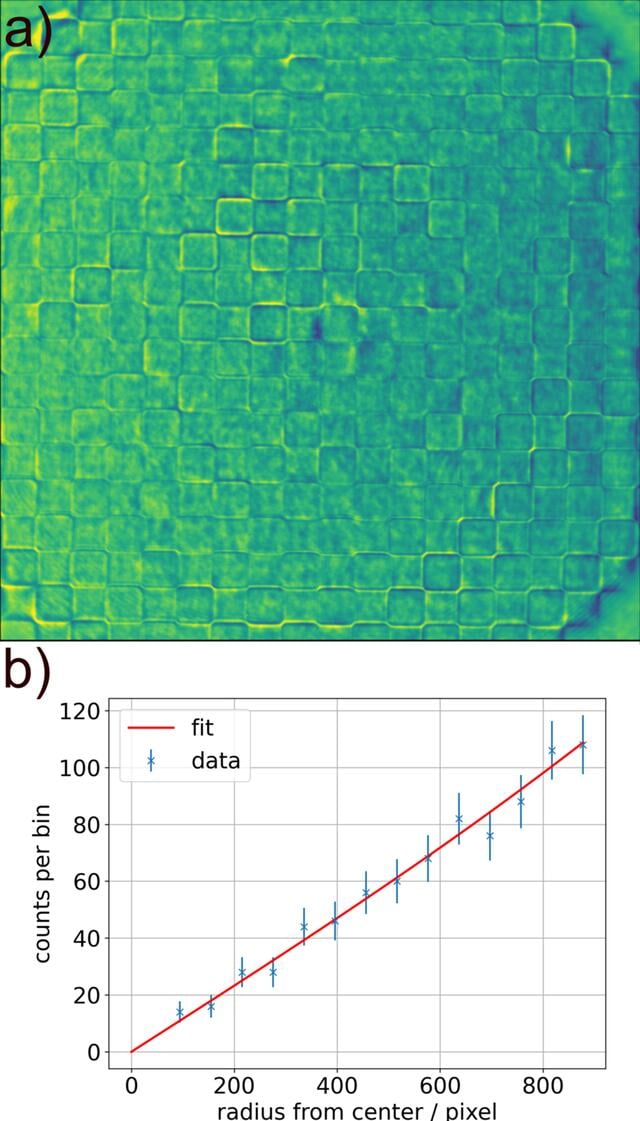
Figure 4
(a) Checkerboard pattern imaged with the diamond CRL at 33 keV. (b) Fit of the edge points per histogram bin in dependence on the radius from the center of mass of the intensity distribution of (a). The error bars represent the statistical uncertainties. A slight deviation from the linear relation is visible. |
 | JOURNAL OF SYNCHROTRON RADIATION |
ISSN: 1600-5775
 access