

 menu


research papers
 | JOURNAL OF SYNCHROTRON RADIATION |
 access
Diamond compound refractive lenses for high-energy dark field X-ray microscopy

aEuropean Synchrotron Radiation Facility, Grenoble, France, bTechnical University of Denmark, Department of Physics, Kgs Lyngby, Denmark, cCentre for X-ray and Nano Science CXNS, Deutsches Elektronen-Synchrotron DESY, Hamburg, Germany, and dMaterials Science and Engineering Department, University of Illinois Urbana-Champaign, Urbana, USA
*Correspondence e-mail: [email protected], [email protected]
Compound refractive lenses (CRLs) are a type of X-ray optics that find widespread applications as focusing and imaging lenses. The choice of material is one of the most defining properties of these lenses. In this work, we present a CRL made out of diamond. It provides an advantageous balance between refractivity and absorption, along with good manufacturability. Compared with Be CRLs, it features a higher and thus enables application at higher photon energies without relying on large lens stacks or very small radii of curvature, which are challenging to manufacture. A diamond CRL is characterized for use as an objective for dark-field X-ray microscopy (DFXM) at the ID03 beamline of the European Synchrotron Radiation Facility and compared with Al and Be CRLs at 17 keV, 33 keV and 37 keV. Increasing the photon energy in DFXM from 17 keV up to 37 keV opens up the possibility to investigate new sample systems that were previously opaque to low-energy X-ray radiation. The capability of the diamond CRL at 33 keV is illustrated through DFXM measurements on two 0.5 mm-thick iron-based samples, which cannot be probed at 17 keV.
Keywords: CRL; diamond; DFXM; X-ray optics.
1. Introduction
The concept of using compound refractive lenses (CRLs) to focus X-rays was first introduced in a 1994 patent by Tomie (Tomie, 1994 ). Tomie proposed that, despite the extremely low refractive indices of materials at X-ray wavelengths, effective focusing could be achieved through a series of concave lenses fabricated from low-atomic-number (low-Z) materials. This transmissive lens-based approach stood in contrast to established methods relying on grazing incidence reflection or diffractive optics such as Fresnel zone plates.
In 1996, Snigirev et al. demonstrated a practical implementation of CRLs at a synchrotron radiation source (Snigirev et al., 1996). By drilling cylindrical holes into an aluminium block, they created the first working prototype of a refractive X-ray lens, thereby establishing the feasibility of compact, in-line X-ray focusing optics for high-energy applications. Since then, CRLs have become a widely adopted solution in synchrotron and XFEL beamlines, used in diverse applications such as phase-contrast imaging, tomography, full-field microscopy, and nano-focused X-ray diffraction (Lengeler et al., 1999).
Manufacturing advances have greatly improved the optical quality of CRLs, enabling sub-micrometre precision and reduced aberrations. Techniques such as deformation via indentation, deep X-ray lithography, LIGA processing, laser micromachining, and 3D nanoprinting now allow the fabrication of lenses from a broad range of materials (Roth et al., 2017). These developments have expanded the design space to include transfocators for focal length adjustment (Snigirev et al., 2009; Vaughan et al., 2011), beam-shaping geometries like alligator lenses (Cederström et al., 2000), and CRLs made from advanced polymers such as SU-8 (Krywka et al., 2016).
Material selection is a key factor in CRL design, as both focusing efficiency and X-ray transmission are determined by the complex refractive index n = 1 − δ + iβ. The real part, δ, governs the lens' focusing power, while the imaginary part, β, describes absorption. For efficient lens systems, especially those with many elements, it is crucial to maximize δ while minimizing β to preserve beam intensity. Fig. 1 shows the ratio δ/β for Al, Be and diamond. Among available materials, beryllium (Be) has long been considered ideal for hard X-ray applications due to its favorable combination of high transmission and sufficient focusing strength (Serebrennikov et al., 2016). Be CRLs have been successfully deployed in both condenser and objective roles, including at the ESRF's ID06-HXM beamline for dark-field X-ray microscopy (DFXM; Kutsal et al., 2019), now upgraded as ID03 (Isern et al., 2025), and in X-ray free-electron laser (XFEL) facilities (Heimann et al., 2016; Zozulya et al., 2019; Dresselhaus-Marais et al., 2023).
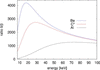 | Figure 1 Ratio of δ/β for the three most commonly used lens materials. |
Despite these advantages, the practical use of Be is increasingly constrained. The material is toxic, brittle, and expensive, with growing difficulties in procurement. Moreover, structural imperfections such as voids, inclusions, and grain boundaries can introduce small-angle scattering, degrading coherence and image quality (Timmann et al., 2009; Roth et al., 2014; Lyatun et al., 2020). These issues have led to the discontinuation of commercial Be lens production, for instance, by RXOPTICS, accelerating the search for alternative materials better suited to modern synchrotron and XFEL environments.
Aluminium lenses are relatively cheap and easy to manufacture and therefore display good imaging performance with small lens errors (Snigirev et al., 1998; Schroer et al., 2000). They are also relatively stable under thermal load in high-flux applications. However, diamond and beryllium offer better transmission, especially at lower energies (below 20 keV to 30 keV).
Nickel CRLs offer a robust option for focusing high-energy X-rays (Nazmov et al., 2005; Andrejczuk et al., 2014; Brancewicz et al., 2016). Since Ni is a rather heavy element, it has a high diffractive power combined with high absorption losses. Therefore, it is mainly applicable at high energies (>30 keV), where the absorption losses are tolerable.
Silicon is a radiation-hard material with excellent thermal and mechanical stability, increasingly used for CRLs in hard X-ray optics (Schroer et al., 2003; Schroer & Lengeler, 2005; Simons et al., 2016; Ruett et al., 2022). Again, compared with Be or diamond lenses, the diffraction to absorption ratio is smaller, especially at lower energies.
Polymeric CRLs fabricated from SU-8 negative photoresist offer a practical solution for X-ray focusing in the 5 keV to 30 keV range (Marschall et al., 2014; Simons et al., 2015; Yildirim et al., 2020; Hlushko et al., 2020). They are comparatively easy and reproducible to manufacture and feature low absorption, but lack radiation hardness and thermal stability.
Among all candidates, diamond has emerged as the most likely material for next-generation CRLs. It combines a relatively low β (high transmission) with high δ (strong focusing) in the hard X-ray regime. Most importantly, its superior makes diamond lenses uniquely suited for high-heat load applications, such as white and pink beam transfocators or XFEL optics (Antipov et al., 2016a; Isern et al., 2025; Yildirim et al., 2025; La Bella et al., 2025; Dresselhaus-Marais et al., 2023; Irvine et al., 2025). The intrinsic radiation hardness and structural integrity of diamond allow stable performance under extreme flux conditions. The single-crystal substrates used for manufacturing diamond CRLs have excellent homogeneity, therefore exhibit much lower small-angle scattering than polycrystalline Be, especially when the optical surfaces are polished (Timmann et al., 2009; Gasilov et al., 2017). Even if the lenses are not polished, they exhibit a similar or lower scattering intensity than comparable polycrystalline Be lenses in small-angle X-ray scattering (SAXS) (Celestre et al., 2022). Despite fabrication challenges, requiring focused ion beam (FIB) milling or laser micromachining, recent advances have demonstrated reliable production of diamond CRLs with excellent optical quality (Snigirev et al., 2002; Antipov et al., 2016b; Polikarpov et al., 2016; Seiboth et al., 2017; Celestre et al., 2022; Wang et al., 2025; Wang et al., 2026).
In this work, we compare and quantify the performance of CRLs fabricated from single-crystal diamond against conventional beryllium and aluminium counterparts under bright-field conditions and show dark-field imaging applications for the diamond CRL. Using a systematic set of test measurements, we assess resolution, field of view and transmission efficiency across a range of photon energies from 17 keV to 37 keV. Diamond CRLs were benchmarked against Be CRLs at 17 keV and Al CRLs at 33 keV, using standardized JIMA resolution targets and Si checkerboards to characterize optical quality and aberrations. Additionally, DFXM measurements at 33 keV were performed on recrystallized ferritic iron and Invar alloy samples to evaluate the suitability of diamond CRLs for high-resolution diffraction contrast imaging, including mosaicity mapping. This comprehensive dataset provides a practical basis for selecting CRL materials for high-flux synchrotron environments and emerging fourth-generation light sources. We show that diamond is a suitable material for CRL manufacturing to replace barely available and toxic Be CRLs. Furthermore, the higher refractive power of diamond CRLs compared with Be CRLs enables existing X-ray microscopes to operate at higher photon energies, thereby extending the usable energy range of the DFXM setup at ID03 in particular. At ID03, the range of applicable samples can be extended to heavier and thicker samples.
The following sections describe the experimental configurations, imaging modalities, and evaluation metrics used in this comparative study.
2. Experimental setup
Different types of CRLs were characterized in terms of their at different energies, the extent of the spatial distortion and their field of view (FOV). Furthermore, two application samples were investigated to showcase the potential of the diamond CRLs for DFXM in Section 3.3. All these measurements were performed at beamline ID03 of the European Synchrotron Radiation Facility (ESRF), which is described in the following subsection. The characterization results of the different CRLs are presented below.
2.1. Lens stacks
Four CRL stacks have been tested in bright-field X-ray microscopy:
(i) At 17 keV, an N = 20, R = 25 µm diamond lens stack and an equivalent N = 88, R = 50 µm Be lens stack.
(ii) At 33 keV, an N = 124, R = 30 µm Al lens stack and an equivalent N = 70, R = 25 µm diamond lens stack.
(iii) The N = 70 diamond CRL was also used for dark-field X-ray microscopy, both at 33 keV and at 37 keV.
Table 1 summarizes the geometrical dimensions of the lens stacks. In the following figures and tables, the symbol C* refers to the diamond CRL.
| ||||||||||||||||||||||||||||||||||||||||||||||||||||||||||


The diamond lens stacks were produced at DESY using femtosecond laser ablation machining into single-crystalline chemical vapor deposited (scCVD) diamond plates (Wang et al., 2025) on either side, leading to bi-concave lenses. No polishing step was applied after the laser-ablation. The surface micro-roughness after the ablation is typically below 200 nm (RMS). As transmission through diamond is high, especially at 33 keV, a tungsten pinhole of 120 µm diameter, slightly smaller than the diamond lens physical aperture, was used to reduce unwanted background from X-rays passing by the side of the physical lens aperture. After every ten lens plates, a previously determined correction optics phase plate was added to the stack in order to compensate for fabrication errors (Seiboth et al., 2017). For the high-energy lens stack, this meant seven correction plates. The benefit of distributing many correction plates along the lens stack is that such a corrected lens stack can be used over a wide X-ray energy range without deteriorating the quality of the correction (Wang et al., 2025). In this publication, the Strehl ratio could be improved from 0.26 to 0.76 using two phase plates for a diamond lens stack consisting of 60 lenses at 17 keV.
The Be lens stack was assembled using Be lenses purchased from RXOPTICS, with a mixture of Be grades coming from powder metallurgy and others from rolled ingot grades (Dombrowski, 1997; Roth et al., 2014). The latter show less SAXS background, but, owing to the high number of required lenses, we were forced to use a mixture, as currently no lenses with rolled ingot grades are commercialized.
The Al lens stack was produced at the ESRF using 99.999% pure aluminium disks of 4 mm diameter and 1 mm thickness, polished to 40 nm r.m.s. surface roughness and pre-thinned to 600 µm, using flat punches. As with the Be lenses, the parabolic lens shape is obtained via a deformation process using two punches, in our case with parabolic R = 30 µm apex-radius tips, made in hardened steel. The width at the apex was 15 µm on average.
2.2. Beamline setup
The ID03 beamline at ESRF (Isern et al., 2025) specializes in dark-field X-ray microscopy, DFXM. This technique utilizes X-ray optics in the Bragg-diffracted beam to image the crystalline microstructure of samples. Using the diffraction contrast, the technique is sensitive to the orientation (mosaicity) and d-spacing (strain) of lattice planes in the sample (Simons et al., 2015; Poulsen et al., 2017). A schematic of DFXM at the ID03 beamline is shown in Fig. 2.
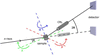 | Figure 2 Schematic of the DFXM setup at the ID03 beamline at the ESRF. Depicted is the basic setup geometry with the dark-field (solid line) and bright-field (dashed line) configuration. In dark-field mode, the incoming beam is diffracted at the sample and the diffracting part of the sample is imaged by the CRL on the detector. Here, θ describes the The CRL objective and the detector are positioned at an angle of 2θ with respect to the optical axis. μ, χ and ω are depicted as well. μ and χ can be used to investigate the mosaicity of a sample by bringing misoriented parts of the sample into diffraction condition. In bright-field mode, the CRL and the detector are in line with the incoming X-ray beam and the sample is imaged via absorption and phase contrast. |
The beamline utilizes a multilayer and a crystal monochromator to monochromatize the X-ray beam generated by a cryogenic permanent magnet in-vacuum undulator. The beam is shaped by several sets of slits before it hits the sample. ID03 has an energy range from 11 keV to 60 keV; DFXM experiments are usually performed at 17 keV or 19 keV. A 1D Be CRL condenser may be used to generate a sheet beam for layered measurements of the sample (section topography). All measurements presented were performed with a box beam. The sample is mounted on a hexapod, which is again mounted on a goniometer for sample alignment and measurement. The goniometer features two axes of translation and two axes of rotation, μ and ω, see Fig. 2. The magnified image is recorded by a far-field detector at a distance of 2.5 m to 5 m downstream of the sample. This is an indirect detector comprising a crystal scintillator, magnifying optics (×2 or ×10), and an sCMOS camera (pco.Edge 4.2BI).
The goniometer angles μ and χ can be used to investigate the mosaicity of a sample to bring different, slightly misoriented sample parts into diffraction condition. The strain of a sample can be investigated by either scanning the scattering angle 2θ by moving the objective and far-field detector, or by scanning the photon energy. Such scans are typically combined with rocking scans (μ). Further experimental details are given by Isern et al. (2025).
In the measurements presented here, the sample-to-detector distance was 5 m. The values for magnification, effective pixel size and exposure time are given in the respective subsections. In general, the magnification is around M = 140–150, including the magnification of the ×10 far-field objective, and the effective pixel size is typically around 40 nm to 50 nm. The exposure time was either 1 s or 2 s, depending on the measurement.
3. Results and discussion
In this section, the results will be presented and discussed.
3.1. Bright-field X-ray microscopy
This subsection presents the resolution, radial distortion, and FOV in bright-field (2θ = 0).
3.1.1. Resolution
The of the diamond CRL was tested at different energies using a JIMA test pattern (JIMA, 2025). The results are compared with those of the Be CRL currently in use at low energies (17 keV) and with an Al CRL at higher energies (33 keV). Furthermore, test patterns have been recorded with the diamond CRL at 37 keV to investigate the potential to use this lens at even higher energies. The diamond lens stack has been adjusted according to the energy as presented in Table 1. For the lower-energy experiment, the energy in the case of the diamond CRL was slightly altered to 17.7 keV, to keep a similar focal distance and magnification as for the Be CRL. We will refer to this energy as 17 keV from here on as well, for the sake of simplicity. For the measurements, the 100 nm, 150 nm and 200 nm structure size test patterns on the JIMA resolution target were imaged in bright-field with the pco far-field detector and the 10× objective. From the images the Michelson contrast was calculated in the vertical and horizontal direction. The results are presented in Table 2, together with the maximum contrast measured in the images on a large structure on the JIMA resolution target. A choice of images of the JIMA test pattern for different combinations of CRLs, photon energies and structure sizes can be seen in Fig. 3. The values for magnification and effective pixel size for the far-field detector with the 10× objective and exposure time of the characterization measurements are given in Table 3. The magnification includes the magnification from the objective. For the 2× objective, the values for magnification and effective pixel size shown in Table 3 scale with a factor of five, accordingly.
| ||||||||||||||||||||||||||||||||||||||||||||||||||||||||||||||||||||||||||||||||||||||||||||
| |||||||||||||||||||||||||||||||||||||||||||||||
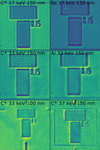 | Figure 3 JIMA test pattern structures for different combinations of CRL objectives, X-ray energies, and structure sizes. |
At 33 keV, the diamond CRL achieves better contrast and resolution than the Al CRL, while at 17 keV the Be CRL provides superior resolution compared with the diamond CRL. This ordering follows directly from the numerical apertures (NAs) of the three-lens systems, with NABe >  at 17 keV and
 > NAAl at 33 keV. At 17 keV, the Be CRL reaches NABe = 5.47 × 10⁻⁴, more than twice that of the diamond CRL ( = 2.25 × 10⁻⁴), which accounts for both the resolution and the contrast difference observed at this energy. For the Al CRL the effective aperture Deff is set by absorption, whereas for the diamond CRL it is limited instead by the 120 µm pinhole placed in front of the lens stack. The Be CRL is aperture-limited as well. The actual aperture of the diamond CRL is 140 µm. The pinhole covers the outer part of the aperture, where the optical properties suffer from manufacturing limitations. Although without the pinhole a theoretical NA of 2.55 × 10⁻⁴ (Lukas, 2026; Lengeler et al., 1999) could be achieved, the resolution would degrade practically. At 33 keV, the diamond CRL reaches
 = 2.02 × 10⁻⁴, exceeding that of the Al lenses (NAAl ≃ 1.5 × 10⁻⁴), and explains the gain in both contrast and resolution. Here, the NA of the Al CRL is absorption-limited in comparison with the diamond CRL, where the NA is aperture-limited. Consistently, the diamond CRL at 33 keV resolves 100 nm structures with a quality comparable with that achieved at 150 nm at 17 keV. Furthermore, as shown in Fig. 3 (bottom right), the diamond CRL is capable of imaging 150 nm structures even at 37 keV.
3.1.2. Radial distortion and FOV
In an effort to characterize radial distortions (pin-cushion or barrel) of the diamond and the Al CRLs at 33 keV and the diamond and the Be CRLs at 17 keV, a 10 µm checkerboard pattern was imaged in direct beam geometry. Previously tested diamond CRLs exhibited serious radial distortion. For this reason, the new diamond CRL together with the existing CRLs were subjected to these measurements. Since radial distortions can heavily affect the image recorded with any microscope, it is important to quantify this effect, so that, if present, it can be corrected in data processing. With this, the distortion of the straight lines of the pattern could be observed. The radial distortion is quantified by applying the first order of the Brown–Conrady radial distortion model (Brown, 1966; Conrady, 1919),

Here, rd is the distorted distance from the pixel in question to the distortion center (which is assumed to be the center of the intensity distribution), ru is the undistorted distance and k1 is the parameter describing the direction and magnitude of the radial distortion. For k1 < 0, rd is smaller than ru and the distorted pixels are shifted towards the distortion center. In this case, the image experiences a barrel distortion. Likewise, for k1 > 0 the image experiences a pin-cushion distortion. A detailed derivation of the k1 parameter from the checkerboard test sample images can be found in Appendix A.
The checkerboard pattern with its known cell size of 10 µm is used as a scale for the calibration of the pixel size. For this, a cell in the center of the FOV is chosen, because there should be no radial distortion present. In addition to that, the measurement of the checkerboard pattern is used to estimate the FOV of the different objectives at different energies by calculating the full width at half-maximum (FWHM) of the intensity distribution. The effective pixel size is given as well. The FOV values are averaged over the x- and y-direction of the image. Note that the measurements for 33 keV were performed with the 10× objective on the pco far-field camera in comparison with the 2× objective for the measurements at 17 keV. The k1 values are given in µm−2 for comparability. An examplary checkerboard image recorded with the diamond CRL at 33 keV and the fit of the histogram of edge points are shown in Fig. 4. The results are shown in Table 4.
| |||||||||||||||||||||||||||||||||||||
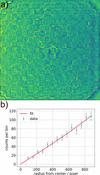 | Figure 4 (a) Checkerboard pattern imaged with the diamond CRL at 33 keV. (b) Fit of the edge points per histogram bin in dependence on the radius from the center of mass of the intensity distribution of (a). The error bars represent the statistical uncertainties. A slight deviation from the linear relation is visible. |
The results show small values for k1. Pin-cushion distortions are noticeable for all lenses, although negative k1 are within the uncertainty budgets for the lenses at 33 keV. The uncertainties are quite high, which shows that the measurement method might not be suitable for quantifying radial distortions that small. For example, k1 = 1.3 × 10⁻⁵ µm−2 for the Be lenses at 17 keV induces a shift of about 960 nm at a radius of 42 µm, which corresponds to a third of the respective FOV. For the lenses at 33 keV, the effect seems to be negligible, considering the high uncertainty budgets. Especially for the Be CRL at 17 keV, the effect should be further investigated and post-processing algorithms should possibly be applied. The FOVs differ rather drastically for different lenses, with the Be lenses exhibiting the largest FOV with 125.11 µm. The diamond lenses have a FOV of around 90 µm at both 17 keV as well as 33 keV, while the Al lenses have the smallest FOV with 64.55 µm.
3.2. Characterization results
The findings of the previous sections regarding the characterization of the different CRLs at different energies are presented in Table 5. The results for the contrast are given for the 150 nm resolution target (averaged over both spatial directions) as well as the results for the FOVs and the theoretical NAs.
| |||||||||||||||||||||||||||||||||||||||||||||||

3.3. High-energy dark-field X-ray microscopy
High-energy DFXM measurements above 30 keV have previously been reported only for a few cases using SU-8 CRL objectives at the ESRF ID06-HXM beamline, the former home of the Hard X-ray Microscope at ESRF (Kutsal et al., 2019; Hlushko et al., 2020; Yildirim et al., 2022). Building on those demonstrations, the new diamond CRL objective was utilized here in two experiments showcasing the potential of diamond optics for high-energy DFXM. At 33 keV, two different iron-based samples were investigated. Operation at 33 keV within the geometrical constraints of ID03 enables access to sample systems that are strongly attenuating at 19 keV and below, thereby extending DFXM to thicker specimens and to compositions containing heavier elements. The results are presented in the following subsections.
3.3.1. Recrystallized iron
The iron sample investigated here was fully recrystallized high-purity iron and is similar to the material studied by Shukla et al. (2025) and Sanna et al. (2026), where full details of the sample preparation and characterization are provided. Briefly, the material was cold rolled to a 90% thickness reduction and subsequently annealed at 700°C for 30 min to achieve a fully recrystallized microstructure. A needle-shaped specimen was extracted from the rolled plate by electrical discharge machining and electro polished to remove surface damage. DFXM measurements were performed near the top section of the sample within a local cylindrical volume of approximately 500 µm in diameter, where the average grain size was 15 µm to 20 µm.
Figs. 5 and 6 show mosaicity maps of two representative grains acquired using the diamond CRL objective at 33 keV, demonstrating the suitability of the optics for high-energy DFXM. The magnification was M = 32.5 with the 2× far-field objective and the effective pixel size was 200.0 nm.
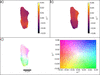 | Figure 5 Grain 1 of the recrystallized iron sample imaged with the diamond CRL objective at 33 keV. (a) Rocking angle μ at maximum intensity for each pixel. (b) Rolling angle χ at maximum intensity for each pixel. (c) Combined intragranular misorientation map referenced to the center of the μ and χ rocking curves, revealing local lattice rotations associated with intragranular defects and elastic strain heterogeneities. The colormap and scale bar are indicated. |
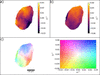 | Figure 6 Grain 2 of the recrystallized iron sample imaged with the diamond lenses at 33 keV. (a) Rocking angle μ at maximum intensity for each pixel. (b) Rolling angle χ at maximum intensity for each pixel. (c) Combined intragranular misorientation map referenced to the center of the μ and χ rocking curves. The colormap and scale bar are indicated. |
The intragranular misorientation maps of the recrystallized iron grains show a narrow angular spread, as expected for fully recrystallized high-purity iron with a low dislocation density on the order of 1011–1012 m−2 (Sanna et al., 2026). Over most of the grain interior, both the μ- and χ-dependent maps exhibit only weak orientation variations, indicating a low level of stored lattice curvature.
In contrast, increased intragranular misorientation is observed in the vicinity of the grain boundaries in both the μ and χ maps. These regions of enhanced angular spread reflect local lattice rotations induced by mechanical constraint and compatibility stresses arising from the interaction with neighboring grains. The combined misorientation maps in Figs. 5 and 6 highlight this behavior, with the largest deviations concentrated near the grain edges, while the grain interior remains comparatively uniform.
3.3.2. Invar
An Invar alloy sample was investigated using DFXM at a photon energy of 33 keV with the diamond CRL objective. Invar is an Fe–Ni alloy known for its low coefficient and features relatively high X-ray attenuation compared with pure iron, making it a representative test case for thicker and compositionally heavier materials. An Fe–36Ni Invar block (composition in wt%: 0.05 C, 0.6 Mn, 0.05 S, 0.40 Si, 38 Ni, 0.5 Co, 0.1 Al, 0.25 Cr, 0.10 Mg, 0.015 P, 0.10 Ti, 0.10 Zr, balance Fe) was heat treated at 825°C for 1.5 h. Specimens were then extracted by electrical discharge machining and polished using diamond suspensions with particle sizes down to 1 µm. The material exhibits a microstructure consisting of equiaxed grains with sizes ranging from approximately 20 µm to 60 µm. The specimen has an approximately square with a thickness of about 400 µm. A single grain within the equiaxed polycrystalline microstructure was selected for imaging, and intragranular mosaicity was mapped by scanning the rocking angle μ and the rolling angle χ. While the grain has a size of about 150 µm and therefore is an outlier in the grain size distribution as described before, representative electron-backscattering diffraction (EBSD) measurements of this Invar alloy confirm the existence of larger grains. Fig. 7 shows the resulting μ- and χ-dependent intensity maps together with the combined intragranular misorientation map. The magnification was M = 32.5 with the 2× far-field objective and the effective pixel size was 200.0 nm. In contrast to the recrystallized pure iron grain, the Invar grain exhibits a significantly larger intragranular orientation spread. It is on the order of ∼0.4°, corresponding to approximately four times the angular spread observed in the recrystallized iron case. Despite this increased spread, the microstructure remains relatively well ordered, with only a limited number of subgrains and localized defect-related features visible in the misorientation maps.
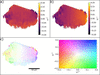 | Figure 7 A grain within the Invar sample imaged with the diamond lenses at 33 keV. (a) Rocking angle μ at maximum intensity for each pixel. (b) Rolling angle χ at maximum intensity for each pixel. (c) Combined intragranular misorientation map referenced to the center of the μ and χ rocking curves. The colormap and scale bar are indicated. |
Taken together, these examples demonstrate that diamond CRL objectives enable high-quality DFXM measurements through sample thicknesses approaching 0.5 mm in iron- and nickel-based materials, which are not readily accessible at the photon energies typically employed with Be CRL optics. Operation at photon energies above 30 keV substantially reduces X-ray absorption and beam-induced heating compared with the 17 keV regime commonly used at ID03, thereby opening new experimental possibilities, including high-energy and pink-beam DFXM imaging modes (Yildirim et al., 2025; La Bella et al., 2025) for high-Z materials.
The results show that diamond CRLs are a viable alternative to common Be CRLs. At 17 keV, they exhibit a smaller FOV and slightly reduced contrast and therefore spatial resolution compared with the Be CRL currently used at ID03. In theory, Be is the superior material for basically all photon energies, but the difference in δ/β ratio gets smaller with increasing photon energy, so that the choice between diamond and beryllium is more ambiguous at 33 keV. At higher energies, the focal length of Be CRLs becomes prohibitively long for use as objective lenses. Instead, the diamond CRL is compared with an aluminium CRL at 33 keV, where it shows slightly better resolution and a larger FOV. None of the investigated lenses exhibit any relevant radial distortion.
4. Conclusion
Diamond CRLs for use as an objective in DFXM were characterized regarding their contrast with different resolution targets from 100 nm to 200 nm and compared with an existing Be CRL at 17 keV and with an Al CRL at 33 keV. At 17 keV, the Be CRL featured slightly better contrast and FOV. At 33 keV, the diamond CRL showed better contrast and FOV than the Al CRL. None of the CRLs exhibited significant radial distortion. For an application example and to showcase the new possibilities with an objective that works at higher photon energies such as 33 keV, a recrystallized iron sample and an Invar alloy sample were investigated with DFXM.
The use of these novel diamond CRLs opens up new possibilities for DFXM. At 33 keV, thick samples or samples containing heavy elements can now be investigated, which before exhibited too much attenuation. For example, an iron sample with a thickness of 500 µm exhibits negligible transmission at 19 keV (8.5 × 10⁻⁶), while for 33 keV the transmission is at least 8.6%, rendering it possible to measure the sample. With the Be CRL and its limited energy range, said iron sample had to be thinned down to 100 µm to achieve a transmission of 9.7% at 19 keV. Working at 33 keV, less sample thinning is necessary and true bulk properties of samples such as iron can be investigated (Schoonjans et al., 2011). Given the limited availability of Be CRLs, diamond CRLs are a more than adequate alternative. Furthermore, diamond CRLs may also be applied as condensers for pink beam applications (Yildirim et al., 2025; La Bella et al., 2025).
APPENDIX A
Derivation of the k1 parameter
The parameter k1 was determined by calculating a histogram of the marked edge points of the checkerboard pattern in dependence on the radial distance to the center of the intensity distribution of the image. For this, all edges of the checkerboard pattern are marked by an algorithm, or, when this was not feasible, by hand. The center of mass of the intensity distribution was determined in the x- and y-direction of the image. The number of edge points N(r) is proportional to the radial distance r, because the area of the annulus A(r) is proportional to the radial distance as well,

Any radial distortion will influence the otherwise constant spacing between the edge points and their density and thereby N(r). This will lead to a deviation of the linear relationship between N(r) and r, which can be described with the Brown–Conrady radial distortion model. Specifically, the number of edge points is proportional to the following formula,

N(r) is then fitted with the following formula,

Here, a is a proportionality factor depending on the edge point spacing and k1 = b/4. A cell close to the intensity distribution center was chosen as the center of the checkerboard pattern and used to measure the size of that cell in pixels, assuming the center of a potential pin-cushion or barrel distortion to be close to the center of the intensity distribution.
Acknowledgements
Wenxin Wang is acknowledged for the fabrication of the diamond CRL at DESY. Dhruv Anjaria is acknowledged for the Invar sample preparation.
Funding information
Dhruv Anjaria (NSF grant No. 2338346) is acknowledged for the Invar sample preparation. CY acknowledges the financial support by the European Research Council Starting Grant `D-REX' No. 101116911. SS acknowledges support by European Research Council Advanced grant No. 885022, by Villum Investigator grant No. 73771, by the Danish Agency for Science and Higher Education grant No. 8144-0002. This study has received financial support from the European Union: AddMorePower (GA 101091621).
References
 Andrejczuk, A., Nagamine, M., Sakurai, Y. & Itou, M. (2014). J. Synchrotron Rad. 21, 57–60. Web of Science CrossRef CAS IUCr Journals Google Scholar
Antipov, S., Baryshev, S., Baturin, S., Chen, G., Kostin, R. & Stoupin, S. (2016a). Proc. SPIE 9963, 99630R. Google Scholar
Antipov, S., Baryshev, S. V., Butler, J. E., Antipova, O., Liu, Z. & Stoupin, S. (2016b). J. Synchrotron Rad. 23, 163–168. CrossRef CAS IUCr Journals Google Scholar
Brancewicz, M., Itou, M., Sakurai, Y., Andrejczuk, A., Chiba, S., Kayahara, Y., Inoue, T. & Nagamine, M. (2016). Rev. Sci. Instrum. 87, 085106. Web of Science CrossRef PubMed Google Scholar
Brown, D. C. (1966). Photogrammetric Eng. 32, 444–462. Google Scholar
Cederström, B., Cahn, R., Danielsson, M., Lundqvist, M. & Nygren, D. R. (2000). Nature 404, 951. Google Scholar
Celestre, R., Antipov, S., Gomez, E., Zinn, T., Barrett, R. & Roth, T. (2022). J. Synchrotron Rad. 29, 629–643. Web of Science CrossRef CAS IUCr Journals Google Scholar
Conrady, A. E. (1919). Mon. Not. R. Astron. Soc. 79, 384–390. CrossRef Google Scholar
Dombrowski, D. E. (1997). Fusion Eng. Des. 37, 229–242. CrossRef CAS Web of Science Google Scholar
Dresselhaus-Marais, L. E., Kozioziemski, B., Holstad, T. S., Raeder, T. M., Seaberg, M., Nam, D., Kim, S., Breckling, S., Choi, S., Chollet, M., Cook, P. K., Folsom, E., Galtier, E., Gonzalez, A., Gorkhover, T., Guillet, S., Haldrup, K., Howard, M., Katagiri, K., Kim, S., Kim, S., Kim, S., Kim, H., Knudsen, E. B., Kuschel, S., Lee, H. J., Lin, C., McWilliams, R. S., Nagler, B., Nielsen, M. M., Ozaki, N., Pal, D., Pablo Pedro, R., Saunders, A. M., Schoofs, F., Sekine, T., Simons, H., van Driel, T., Wang, B., Yang, W., Yildirim, C., Poulsen, H. F. & Eggert, J. H. (2023). Sci. Rep. 13, 17573. PubMed Google Scholar
Gasilov, S., Mittone, A., dos Santos Rolo, T., Polyakov, S., Zholudev, S., Terentyev, S., Blank, V., Bravin, A. & Baumbach, T. (2017). J. Synchrotron Rad. 24, 1137–1145. Web of Science CrossRef CAS IUCr Journals Google Scholar
Heimann, P., MacDonald, M., Nagler, B., Lee, H. J., Galtier, E., Arnold, B. & Xing, Z. (2016). J. Synchrotron Rad. 23, 425–429. Web of Science CrossRef CAS IUCr Journals Google Scholar
Hlushko, K., Keckes, J., Ressel, G., Pörnbacher, J., Ecker, W., Kutsal, M., Cook, P., Detlefs, C. & Yildirim, C. (2020). Scr. Mater. 187, 402–406. CrossRef CAS Google Scholar
Irvine, S. J., Katagiri, K., Raeder, T. M., Boesenberg, U., Chalise, D., Stanton, J. I., Pal, D., Hallmann, J., Ansaldi, G., Brauße, F., Eggert, J. H., Fang, L., Folsom, E., Haubro, M., Holstad, T. S., Madsen, A., Möller, J., Nielsen, M. M., Poulsen, H. F., Pudell, J.-E., Rodriguez-Fernandez, A., Schoofs, F., Seiboth, F., Wang, Y., Jo, W., Youssef, M., Zozulya, A., Haldrup, K. & Dresselhaus-Marais, L. E. (2025). J. Appl. Phys. 137, 053106. CrossRef Google Scholar
Isern, H., Brochard, T., Dufrane, T., Brumund, P., Papillon, E., Scortani, D., Hino, R., Yildirim, C., Rodriguez Lamas, R., Li, Y., Sarkis, M. & Detlefs, C. (2025). J. Phys. Conf. Ser. 3010, 012163. CrossRef Google Scholar
JIMA (2025). JIMA 100 nm resolution target, https://www.jima.jp/content/pdf/catalog_rt_rc04_eng.pdf. Google Scholar
Krywka, C., Last, A., Marschall, F., Márkus, O., Georgi, S., Müller, M. & Mohr, J. (2016). AIP Conf. Proc. 1764, 020001. Google Scholar
Kutsal, M., Bernard, P., Berruyer, G., Cook, P. K., Hino, R., Jakobsen, A. C., Ludwig, W., Ormstrup, J., Roth, T., Simons, H., Smets, K., Sierra, J. X., Wade, J., Wattecamps, P., Yildirim, C., Poulsen, H. F. & Detlefs, C. (2019). IOP Conf. Ser. Mater. Sci. Eng. 580, 012007. Google Scholar
La Bella, M., Poulsen, H. F., Staeck, S., Henningsson, N. A., Kabukcuoglu, M. P., Detlefs, C. & Yildirim, C. (2025). arXiv:2510.26665. Google Scholar
Lengeler, B., Schroer, C., Tümmler, J., Benner, B., Richwin, M., Snigirev, A., Snigireva, I. & Drakopoulos, M. (1999). J. Synchrotron Rad. 6, 1153–1167. Web of Science CrossRef IUCr Journals Google Scholar
Lukas, T. (2026). Nanoprobe calculator, https://lenscalc.desy.de/. Google Scholar
Lyatun, I., Ershov, P., Snigireva, I. & Snigirev, A. (2020). J. Synchrotron Rad. 27, 44–50. Web of Science CrossRef CAS IUCr Journals Google Scholar
Marschall, F., Last, A., Simon, M., Kluge, M., Nazmov, V., Vogt, H., Ogurreck, M., Greving, I. & Mohr, J. (2014). J. Phys. Conf. Ser. 499, 012007. CrossRef Google Scholar
Nazmov, V., Reznikova, E., Snigirev, A., Snigireva, I., DiMichiel, M., Grigoriev, M., Mohr, J., Matthis, B. & Saile, V. (2005). Microsyst Technol. 11, 292–297. CrossRef CAS Google Scholar
Polikarpov, M., Polikarpov, V., Snigireva, I. & Snigirev, A. (2016). Phys. Proc. 84, 213–220. CrossRef CAS Google Scholar
Poulsen, H. F., Jakobsen, A. C., Simons, H., Ahl, S. R., Cook, P. K. & Detlefs, C. (2017). J. Appl. Cryst. 50, 1441–1456. Web of Science CrossRef CAS IUCr Journals Google Scholar
Roth, T., Alianelli, L., Lengeler, D., Snigirev, A. & Seiboth, F. (2017). MRS Bull. 42, 430–436. Web of Science CrossRef Google Scholar
Roth, T., Helfen, L., Hallmann, J., Samoylova, L., Kwaśniewski, P., Lengeler, B. & Madsen, A. (2014). Proc. SPIE 9207, 920702. Google Scholar
Ruett, U., Gades, L., Borkiewicz, O., Quaranta, O., Beyer, K., Jennings, G., Suzanne Miller, C. & Miceli, A. (2022). J. Phys. Conf. Ser. 2380, 012060. CrossRef Google Scholar
Sanna, V., Zhang, Y., Ludwig, W., Shukla, A., Benhadjira, A., Sarkis, M. & Yildirim, C. (2026). arXiv:/2603.08968. Google Scholar
Schoonjans, T., Brunetti, A., Golosio, B., Sanchez del Rio, M., Solé, V. A., Ferrero, C. & Vincze, L. (2011). At. Spectrosc. 66, 776–784. Web of Science CrossRef CAS Google Scholar
Schroer, C., Lengeler, B., Benner, B., Tümmler, J., Günzler, F., Drakopoulos, M., Simionovici, A., Snigirev, A. & Snigireva, I. (2000). AIP Conf. Proc. 507, 694–699. CrossRef CAS Google Scholar
Schroer, C. G., Kuhlmann, M., Hunger, U. T., Günzler, T. F., Kurapova, O., Feste, S., Frehse, F., Lengeler, B., Drakopoulos, M., Somogyi, A., Simionovici, A. S., Snigirev, A., Snigireva, I., Schug, C. & Schröder, W. H. (2003). Appl. Phys. Lett. 82, 1485–1487. Web of Science CrossRef CAS Google Scholar
Schroer, C. G. & Lengeler, B. (2005). Phys. Rev. Lett. 94, 054802. Web of Science CrossRef PubMed Google Scholar
Seiboth, F., Schropp, A., Scholz, M., Wittwer, F., Rödel, C., Wünsche, M., Ullsperger, T., Nolte, S., Rahomäki, J., Parfeniukas, K., Giakoumidis, S., Vogt, U., Wagner, U., Rau, C., Boesenberg, U., Garrevoet, J., Falkenberg, G., Galtier, E. C., Ja Lee, H., Nagler, B. & Schroer, C. G. (2017). Nat. Commun. 8, 14623. Web of Science CrossRef PubMed Google Scholar
Serebrennikov, D., Clementyev, E., Semenov, A. & Snigirev, A. (2016). J. Synchrotron Rad. 23, 1315–1322. Web of Science CrossRef CAS IUCr Journals Google Scholar
Shukla, A., Yildirim, C., Ball, J. A. D., Detlefs, C., Cretton, A. A. W., Sarkis, M., La Bella, M., Ludwig, W., Zhang, Y. & Henningsson, N. A. (2025). arXiv:2508.17897. Google Scholar
Simons, H., King, A., Ludwig, W., Detlefs, C., Pantleon, W., Schmidt, S., Stöhr, F., Snigireva, I., Snigirev, A. & Poulsen, H. F. (2015). Nat. Commun. 6, 6098. Web of Science CrossRef PubMed Google Scholar
Simons, H., Stöhr, F., Michael-Lindhard, J., Jensen, F., Hansen, O., Detlefs, C. & Poulsen, H. F. (2016). Opt. Commun. 359, 460–464. Web of Science CrossRef CAS Google Scholar
Snigirev, A. A., Yunkin, V., Snigireva, I., Di Michiel, M., Drakopoulos, M., Kouznetsov, S., Shabel'nikov, L., Grigoriev, M., Ralchenko, V., Sychbsp;ov, I., Hoffmann, M. & Voges, E. I. (2002). Proc. SPIE 4783, 1–9. CrossRef CAS Google Scholar
Snigirev, A., Kohn, V., Snigireva, I. & Lengeler, B. (1996). Nature 384, 49–51. CrossRef CAS Web of Science Google Scholar
Snigirev, A., Kohn, V., Snigireva, I., Souvorov, A. & Lengeler, B. (1998). Appl. Opt. 37, 653–662. Web of Science CrossRef PubMed CAS Google Scholar
Snigirev, A., Snigireva, I., Vaughan, G., Wright, J., Rossat, M., Bytchkov, A. & Curfs, C. (2009). J. Phys. Conf. Ser. 186, 012073. CrossRef Google Scholar
Timmann, A., Döhrmann, R., Schubert, T., Schulte-Schrepping, H., Hahn, U., Kuhlmann, M., Gehrke, R., Roth, S. V., Schropp, A., Schroer, C. & Lengeler, B. (2009). Rev. Sci. Instrum. 80, 046103. Web of Science CrossRef PubMed Google Scholar
Tomie, T. (1994). Japanese Patent 6-045288. Google Scholar
Vaughan, G. B. M., Wright, J. P., Bytchkov, A., Rossat, M., Gleyzolle, H., Snigireva, I. & Snigirev, A. (2011). J. Synchrotron Rad. 18, 125–133. Web of Science CrossRef IUCr Journals Google Scholar
Wang, W., Döhrmann, R., Botta, S., Madsen, A., Schroer, C. G. & Seiboth, F. (2025). Opt. Express 33, 22349–22359. Web of Science CrossRef CAS PubMed Google Scholar
Wang, Y., Chang, G., Li, M., Xue, L., Li, Z. & Zhang, W. (2026). Nucl. Instrum. Methods Phys. Res. A 1090, 171668. CrossRef Google Scholar
Yildirim, C., Cook, P., Detlefs, C., Simons, H. & Poulsen, H. F. (2020). MRS Bull. 45, 277–282. Web of Science CrossRef Google Scholar
Yildirim, C., Mavrikakis, N., Cook, P., Rodriguez-Lamas, R., Kutsal, M., Poulsen, H. & Detlefs, C. (2022). Scr. Mater. 214, 114689. Web of Science CrossRef Google Scholar
Yildirim, C., Shukla, A., Zhang, Y., Mavrikakis, N., Lesage, L., Sanna, V., Sarkis, M., Li, Y., La Bella, M., Detlefs, C. & Poulsen, H. F. (2025). Commun. Mater. 6, 198. Web of Science CrossRef PubMed Google Scholar
Zozulya, A. V., Batchelor, L., Appel, K., Boesenberg, U., Hallmann, J., Kim, C., Lobato, I., Lu, W., Mammen, C., Möller, J., Roth, T., Samoylova, L., Scholz, M., Shayduk, R., Sukharnikov, K. & Madsen, A. (2019). Proc. SPIE 11111, 111110H. Google Scholar
This is an open-access article distributed under the terms of the Creative Commons Attribution (CC-BY) Licence, which permits unrestricted use, distribution, and reproduction in any medium, provided the original authors and source are cited.
| JOURNAL OF SYNCHROTRON RADIATION |