

 menu
|
|
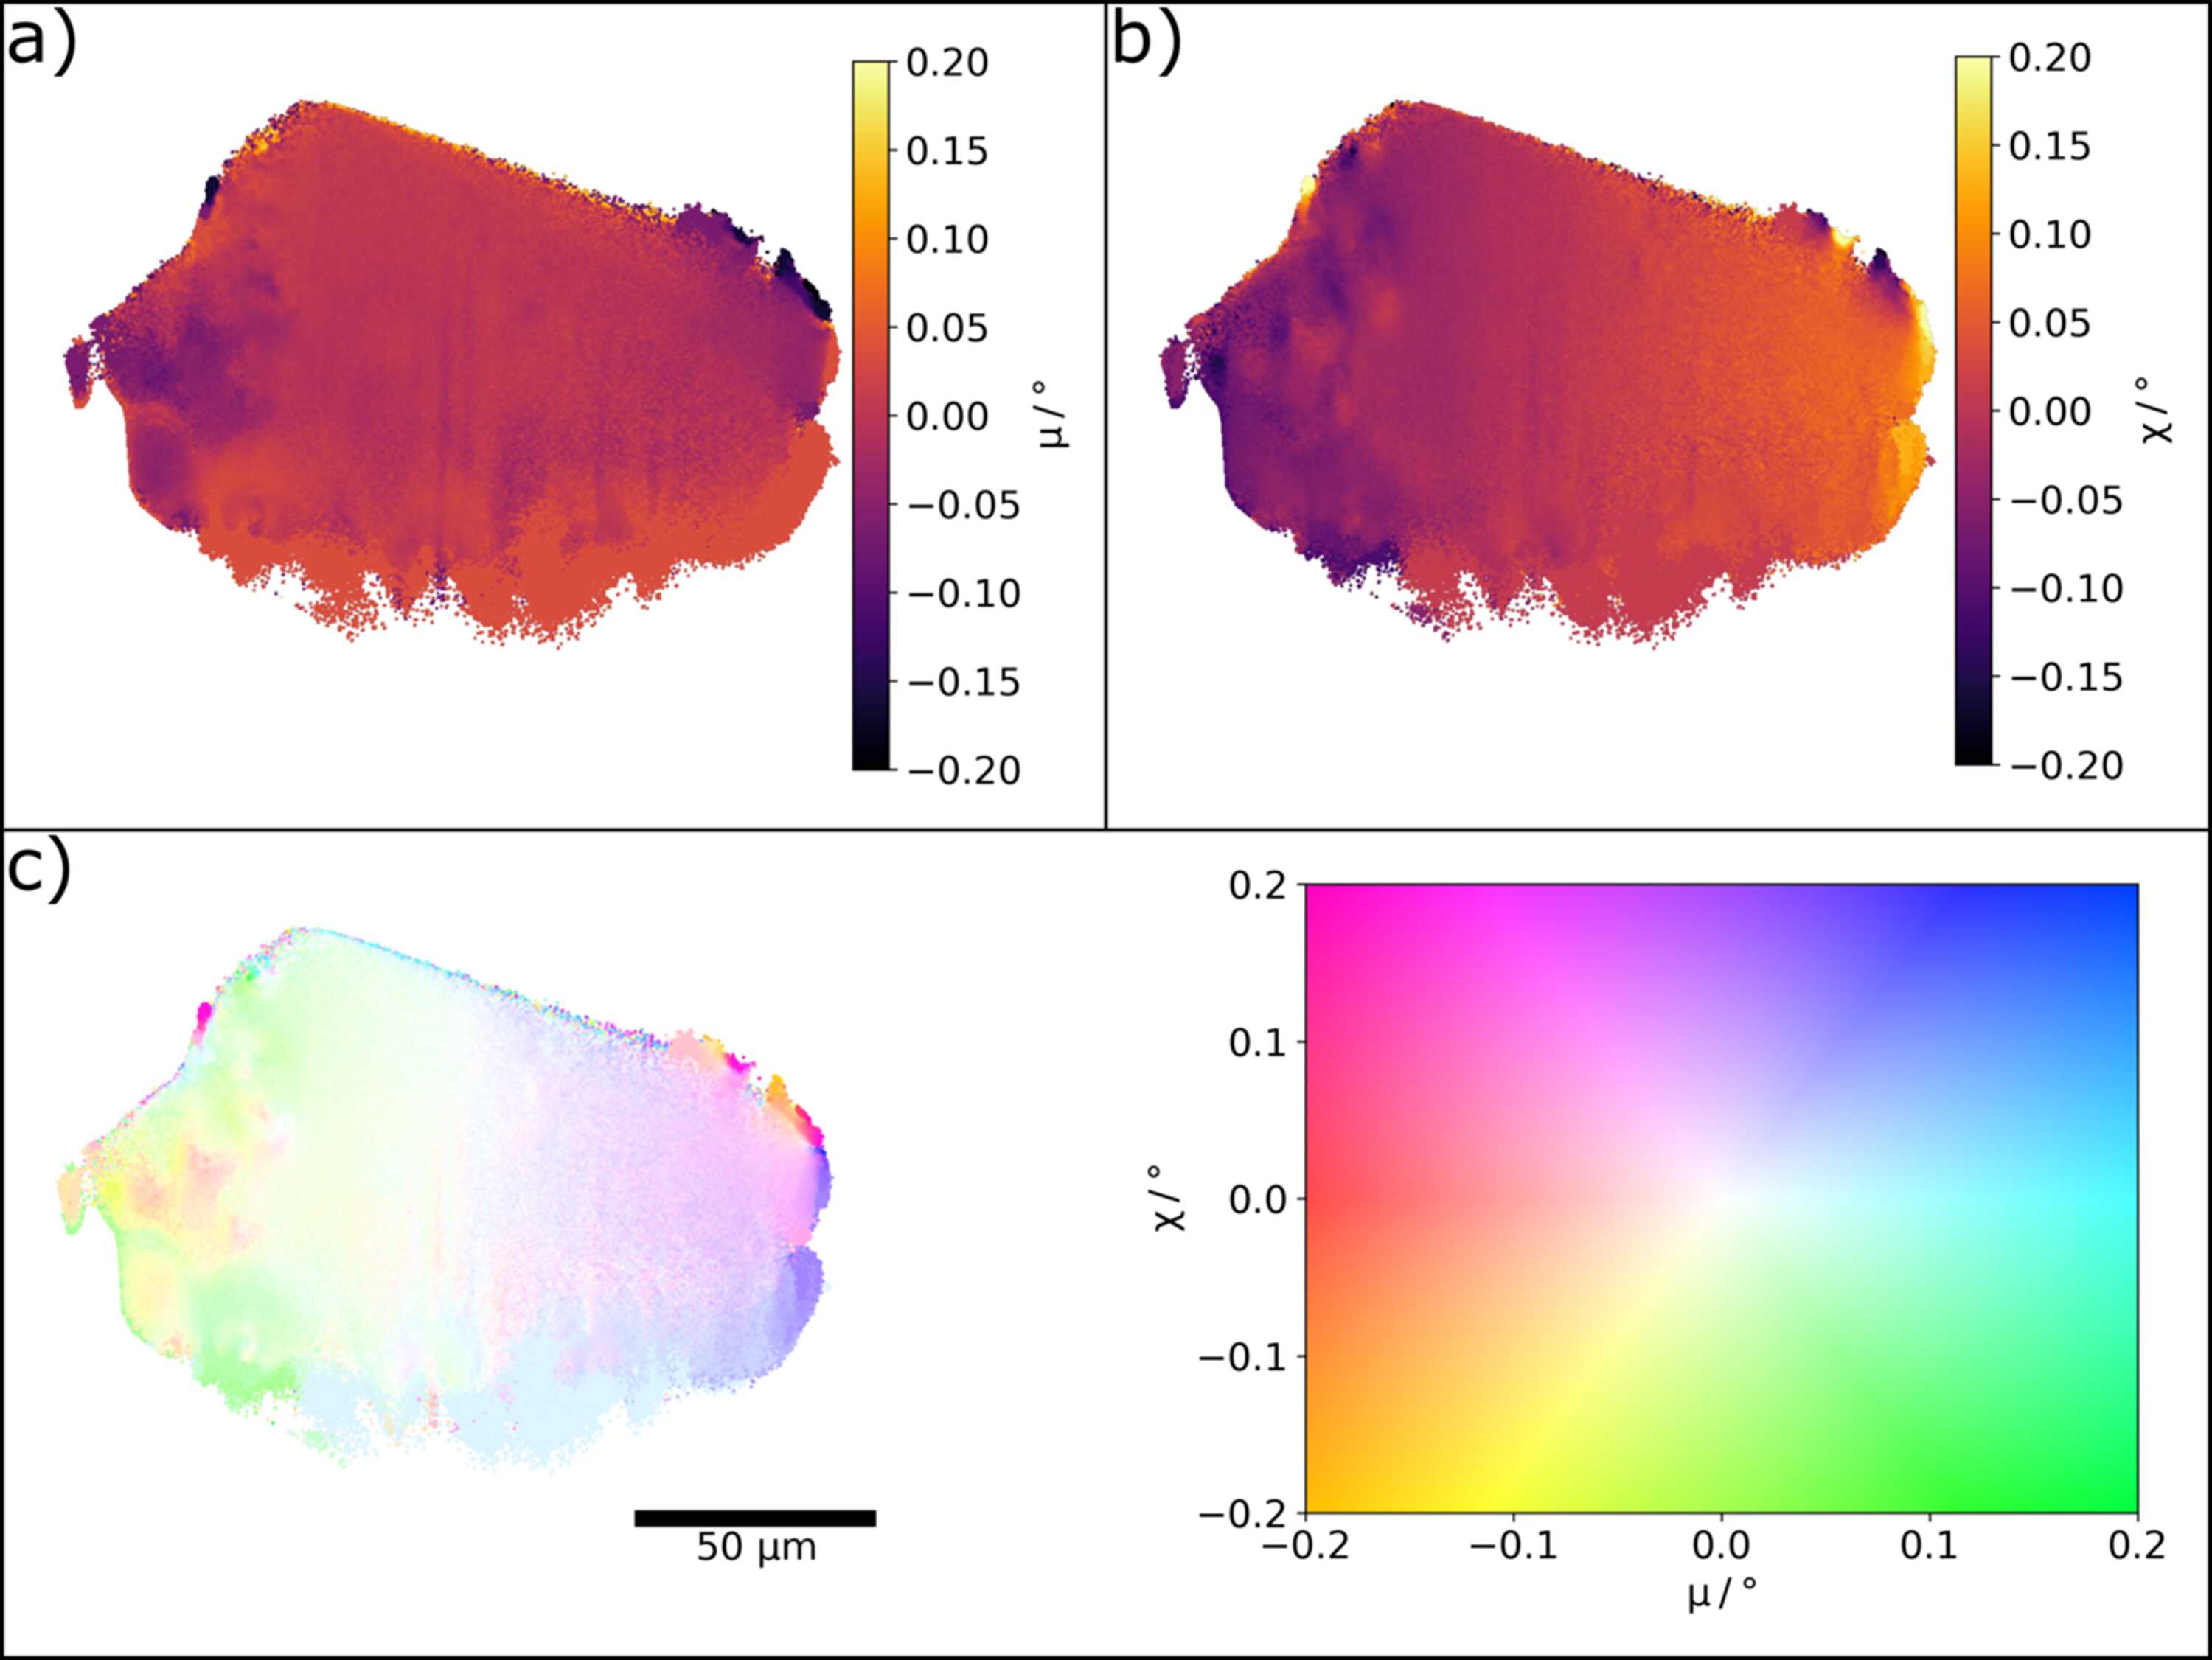
Figure 7
A grain within the Invar sample imaged with the diamond lenses at 33 keV. (a) Rocking angle μ at maximum intensity for each pixel. (b) Rolling angle χ at maximum intensity for each pixel. (c) Combined intragranular misorientation map referenced to the center of the μ and χ rocking curves. The colormap and scale bar are indicated. |
 | JOURNAL OF SYNCHROTRON RADIATION |
ISSN: 1600-5775
 access