

 menu
|
|
Figure 10
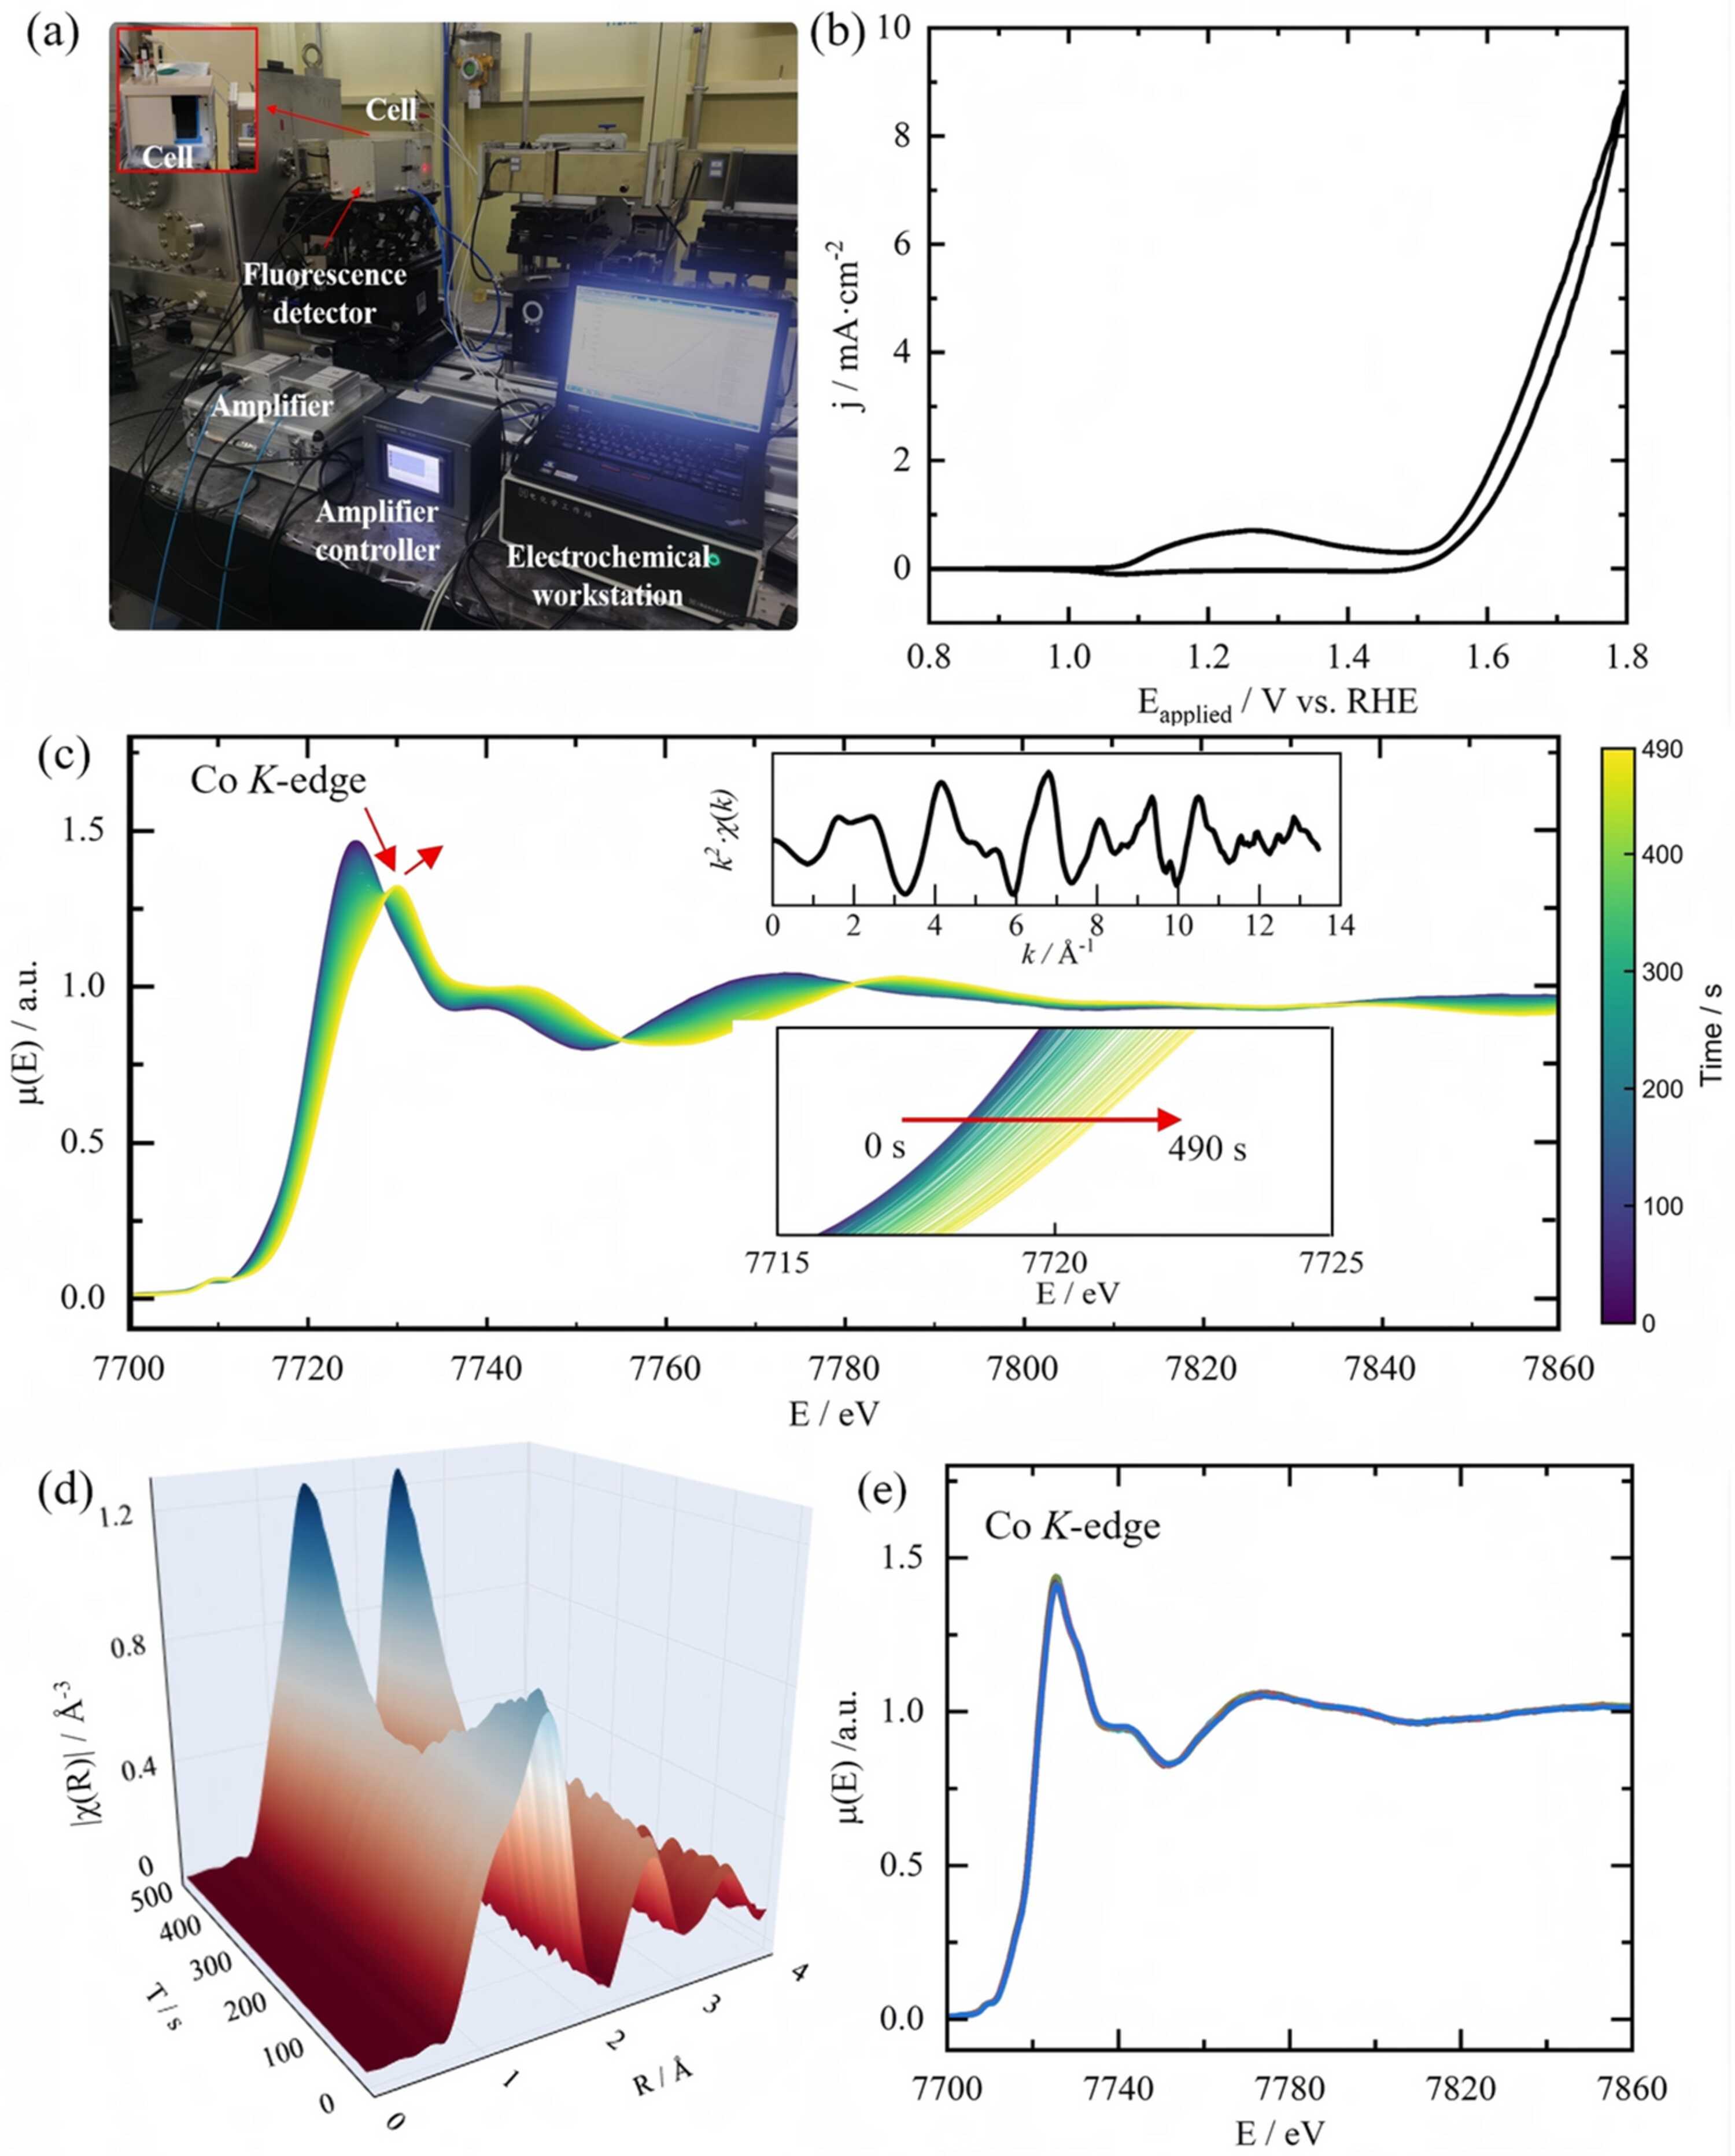
In situ QXAFS characterization of β-CoMoO4 under OER conditions. (a) Photograph of the operando electrochemical QXAFS setup at the BL11B beamline. (b) First-cycle CV curve of β-CoMoO4 in 1 M KOH (pH = 13.5) with a potential window of 0.8–1.8 V versus RHE at a scan rate of 2.5 mV s−1. (c) Operando time-resolved Co K-edge QXAFS spectra collected during the CV scanning. The upper and lower insets provide a magnified view of the k2-weighted EXAFS and the absorption-edge (XANES) regions, respectively. (d) 3D surface plot of the Fourier-transformed EXAFS spectra in R-space, illustrating the dynamic evolution of Co coordination structures as a function of the applied potential. (e) Selected XANES spectra extracted every 100 s (5 s per spectrum, 1000 spectra in total) under the pH = 12 condition. The spectra show no systematic edge shift or line-shape change within the observed variation, indicating no significant structural reconstruction within 5000 s. |
 | JOURNAL OF SYNCHROTRON RADIATION |
ISSN: 1600-5775
 access