

 menu


- 1. Introduction
- 2. Experimental section
- 3. Performance evaluation and rapid-scan spectral characteristics of the QXAFS platform
- 4. Application: in situ tracking of electrochemical reconstruction
- 5. Physical limits and methodological guidelines for QXAFS
- 6. Conclusion
- Supporting information
- References
beamlines
 | JOURNAL OF SYNCHROTRON RADIATION |
 access
Construction and performance of the millisecond-to-second QXAFS platform at SSRF BL11B for in situ dynamic characterization

aShanghai Synchrotron Radiation Facility, Shanghai Advanced Research Institute, Chinese Academy of Sciences, Shanghai 201204, People's Republic of China, bShanghai Institute of Applied Physics, Chinese Academy of Sciences, Shanghai 201800, People's Republic of China, and cUniversity of Chinese Academy of Sciences, Beijing 100049, People's Republic of China
*Correspondence e-mail: [email protected], [email protected]
A dedicated quick-scanning X-ray absorption fine-structure (QXAFS) platform has been established at the SSRF BL11B beamline for in situ and operando studies of dynamic structural evolution on the millisecond-to-second timescale. The system combines a torque-motor-driven Si(111) monochromator, synchronized high-speed acquisition and automated data processing, and operates over an energy range of 5–26.5 keV. Rapid measurements were demonstrated with spectrum acquisition times down to 10 ms for narrow-range XANES, 16.7 ms for full-range EXAFS extending up to k ≃ 12.5 Å−1, and 50 ms for fluorescence-mode XANES on dilute samples. Quantitative evaluation of frequency-dependent spectral quality further defines practical monochromator oscillation frequencies for the present BL11B platform: approximately 4 Hz for full-range EXAFS over a ∼1000 eV scan window and approximately 30 Hz for short-range XANES over a ∼130 eV scan window, with these recommendations determined by the response characteristics of the current detection system. The capability of the platform is illustrated by in situ monitoring of electrocatalyst reconstruction during the oxygen evolution reaction.
Keywords: QEXAFS; time-resolved XAFS; synchrotron radiation; in situ characterization; noise quantification; energy chemistry.
1. Introduction
The transition toward a sustainable energy infrastructure relies critically on the advancement of highly efficient energy conversion and storage technologies (Olabi & Abdelkareem, 2022 ; Amir et al., 2023). Consequently, significant progress has been achieved in energy chemistry and catalysis, particularly in electrocatalytic water splitting (Chatenet et al., 2022; Shih et al., 2022), electrochemical carbon dioxide reduction (Wang et al., 2021), and advanced lithium-ion batteries (Xie & Lu, 2020). The core of these technologies involves complex interfacial reactions driven by the rapid, dynamic evolution of active sites. For example, during the catalytic oxygen evolution reaction, the continuous structural transformations and oxidation state transitions of the catalyst, driven by the applied potential, typically proceed on a timescale of seconds (Vogt & Weckhuysen, 2022). Similarly, for high-rate battery charging (>10 C), the phase transitions and structural evolution of cathode materials, induced by rapid (de)intercalation, typically unfold on a timescale of seconds to minutes (Zhou et al., 2016). Accordingly, capturing these operando structural dynamics in real time is crucial for unravelling fundamental reaction mechanisms and rationally designing high-performance energy materials.
Among operando characterization techniques, quick-scanning X-ray absorption fine structure (QXAFS) enables element-specific electronic states and local coordination changes to be monitored over millisecond-to-minute timescale. For example, sub-second QXAFS has been used to correlate the structural evolution of copper species with product selectivity during pulsed electrochemical CO2 reduction (Timoshenko et al., 2022). In energy storage materials, continuous monitoring of valence and coordination states has been used to follow multistep lithiation and delithiation pathways of various 3d transition metals (Luo et al., 2022). QXAFS has also been applied to track the structural evolution of single-atom Au species during acetylene hydrochlorination under realistic working conditions (Malta et al., 2017). Collectively, these representative operando studies demonstrate the utility of time-resolved QXAFS for linking macroscopic functional performance with atomic-level structural evolution.
The continuous-scanning approach underlying QXAFS was developed by Frahm (1988, 1989), who originally termed the method quick-EXAFS (QEXAFS) and realized time-resolved XAFS on the timescale of seconds using an `on the fly' mode of a double-crystal monochromator. To further push the limits of temporal resolution, subsequent advancements introduced piezo-actuated monochromators, which dramatically improved the time resolution of XANES to approximately 5 ms (Bornebusch et al., 1999; Richwin et al., 2001, 2002). However, the restricted energy range and practical durability challenges within ultra-high vacuum (UHV) environments hindered the widespread adoption of these piezo-actuated devices. To overcome these constraints, eccentric cam-driven channel-cut monochromators were developed (Frahm et al., 2004, 2005). Although mechanically complex, this design combines enhanced long-term stability with a broad energy range, delivering time resolutions down to 12.5 ms (Briois et al., 2016; La Fontaine et al., 2020). More recently, direct-drive systems have been developed in which the monochromator crystal is driven directly by a high-speed motor. Nonaka et al. reported a direct-drive system based on an AC servo motor, achieving acquisition times of 10 ms for XANES and 25 ms for Cu K-edge EXAFS (Nonaka et al., 2012, 2016). In a different direct-drive configuration, Müller et al. used a torque motor mounted coaxially on a goniometer to drive a rapidly oscillating crystal stage, achieving 10 ms Cu K-edge XANES and 16.7 ms Cu K-edge EXAFS (Müller et al., 2016). In these systems, the scan range, oscillation frequency and trajectory can be adjusted through the motor-control parameters. Direct-drive configurations have subsequently been implemented at beamlines including SuperXAS at the Swiss Light Source (SLS), P64 at PETRA III, and beamline 44A at the Taiwan Photon Source (Müller et al., 2016; Bornmann et al., 2019; Pao et al., 2021). Table 1 summarizes the core characteristics of these QXAFS techniques.
|
||||||||||||||||||||||||||||||||
To address the need for tracking rapid structural evolution in energy materials and chemical reactions, we have commissioned a user-oriented QXAFS platform at the BL11B beamline of the Shanghai Synchrotron Radiation Facility (SSRF). This work presents the integration and systematic characterization of the platform, which combines a torque-motor-driven monochromator, synchronized signal acquisition, dedicated detection schemes and automated data-processing software. We describe the beamline implementation and processing workflow, evaluate performance under representative operating conditions, and analyse the factors governing spectral fidelity during rapid acquisition. The capability of the platform is further demonstrated through an in situ electrocatalysis experiment, illustrating its applicability to time-resolved studies of dynamic material transformations. Together, these results establish BL11B as a practical QXAFS capability for routine in situ and operando investigations.
2. Experimental section
2.1. Beamline overview
The BL11B at SSRF is a bending-magnet beamline dedicated to XAFS studies, designed to address the growing demands of cutting-edge scientific research in fields such as energy materials and catalysis (Chen et al., 2024). BL11B is the first operational beamline constructed during the SSRF Phase-II project (Tai & Zhao, 2024). As illustrated in the optical layout (Fig. 1), the beamline is equipped with a double-crystal monochromator for conventional step-scan XAFS and a dedicated channel-cut monochromator for QXAFS. A Pt/Rh-coated collimating mirror is placed upstream of the monochromator to reduce vertical beam divergence. Downstream, a Pt/Ru-coated toroidal mirror focuses the beam and compensates for the vertical beam offset during XAFS scans. To suppress higher-order harmonics in the low-energy range, a harmonic rejection mirror with Si, Cr, and Rh coatings is positioned upstream of the sample. Primary beamline parameters are summarized in Table 2.
|
||||||||||||||||||||||||
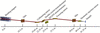
|
Figure 1
Schematic layout of the main optical configuration at the SSRF BL11B beamline. |
2.2. QXAFS monochromator
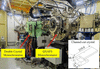
The QXAFS monochromator (RI Research Instruments GmbH), located 23.9 m from the source, is the key component for rapid-scanning experiments (Fig. 2). It employs a torque-motor-driven design originally developed by Frahm (Müller et al., 2015) and can operate at oscillation frequencies of up to 50 Hz. A Si(111) channel-cut crystal was selected as a practical compromise among photon flux, accessible energy range, energy resolution and time-resolved experimental feasibility. Its usable energy range of 5–26.5 keV covers the K-edges of elements from Ti to Ag, matching the primary scientific scope of BL11B, which is focused on K-edge XAFS of 3d transition metals and selected 4d elements.
|
Figure 2
Photograph of the dedicated QXAFS monochromator installed at the BL11B beamline. The inset displays the geometric dimensions of the Si(111) channel-cut crystal (in mm). |
Although Si(311) offers higher intrinsic energy resolution, Si(111) provides substantially higher photon flux under the present BL11B conditions, typically by a factor of about five to six. This flux advantage is especially important for quick-scanning measurements and for fluorescence-mode studies of dilute or operando samples, where photon statistics often become the practical limiting factor. For the intended BL11B applications, Si(111) still provides sufficient spectral fidelity for routine oxidation-state tracking and local coordination analysis, whereas Si(311) remains preferable when the highest possible resolution of subtle near-edge features is required. The spectral performance of the Si(111) configuration near the upper end of the accessible energy range is experimentally evaluated at the Ag K-edge in Section S1 of the supporting information.
The Si(111) channel-cut crystal was fabricated with an azimuthal angle of φ = 0°, where φ is defined as the angle between the  direction and the projection of the electric-field vector E onto the (111) surface. To reduce the rotational torque during rapid scanning and minimize beam-position changes over the energy range, the Bragg rotation axis was positioned at the centre of the first reflecting surface of the Si(111) channel-cut crystal. The monolithic crystal block has overall dimensions of 219.0 mm × 75.0 mm × 64.5 mm, with first and second crystal blades of 70 and 167 mm in length, respectively. During QXAFS measurements, the Bragg angle is monitored by an in-vacuum fast incremental optical encoder (Renishaw: Tonic T2651-15M). The encoder and detector signals are recorded synchronously using the manufacturer-supplied QXAFS data-acquisition system described in Section 2.4. The fast-scan encoder provides a theoretical angular resolution of 0.4 µrad (∼0.016 eV at the Cu K-edge), far below the experimental sampling grid and the intrinsic core-hole broadening, ensuring that encoder quantization does not convolve or distort the measured line shapes.
2.3. QXAFS detection system
For transmission-mode QXAFS measurements, we employed gridded ionization chambers (GICs) with an intrinsic detector response time of less than 5.5 µs (Müller et al., 2013), providing a response sufficiently fast for the rapid QXAFS measurements reported here. The GICs are operated with nitrogen gas at atmospheric pressure during the benchmark measurements to maintain consistent detection conditions. For routine user experiments, BL11B is equipped with an automatic He/N2/Ar/Kr gas-mixing system, with the gas composition selected according to the absorption-edge of the measured element. Further details are provided in Section S2 of the supporting information.
For fluorescence-yield QXAFS, achieving high temporal resolution requires a high-speed detector for the fluorescence signal. For the millisecond-scale fluorescence QXAFS measurements reported here, the platform utilizes a passivated implanted planar silicon (PIPS) detector with a 50 mm active diameter. The inherent signal ringing, caused by the large junction capacitance of the PIPS diode, was effectively mitigated by integrating a tailored feedback capacitor into the preamplifier circuit (Clark et al., 2020a). Systematic tuning of the filter time constants showed that a time constant of 30 µs provides an appropriate balance between signal fidelity and high-speed response. This PIPS-based configuration provided the response required for the millisecond fluorescence QXAFS measurements reported here. For slower operando measurements on the sub-second-to-second timescale, a custom multi-grid ionization chamber (fast-Lytle; Lytle et al., 1984; Suzuki et al., 2002) was used, as the measured system response (∼650 µs) was adequate for that measurement regime. Detailed detector characterization and application scenarios are provided in Section S3 of the supporting information.
The analog current signals from these detectors, typically in the range of 10−9 to 10−6 A, are converted to voltage using low-noise, high-speed current amplifiers (ION-4001 and ION-5004, Ionitech Müller & Szillat GbR) and subsequently digitized by a dedicated data acquisition system.
2.4. Data acquisition system
The QXAFS monochromator can be operated in two acquisition modes: step-scan and rapid-scan. When operated in step-scan mode, control and data acquisition are handled by the in-house-developed EPICS-based beamline control and data-acquisition system described previously (Lu et al., 2016; Chen et al., 2024). For rapid QXAFS measurements, data acquisition is handled by the software supplied with the QXAFS monochromator system by RI Research Instruments GmbH.
This software interfaces with a National Instruments (NI) PXIe-6366 module, which provides eight-channel simultaneous sampling at rates of up to 2 MHz. The Bragg-angle encoder and detector signals are acquired synchronously during continuous monochromator oscillation. The detailed hardware architecture and signal flow are provided in Section S4 of the supporting information.
2.5. Graphical data processing software
To efficiently process the high-volume, oversampled QXAFS data streams, we developed a dedicated Python-based graphical user interface (GUI) termed QXAFS Data Studio. The software builds on the general processing approach established in ProQEXAFS (Clark et al., 2020b), while being adapted to the BL11B acquisition architecture and routine user workflow. Designed for the rapid reduction of in situ time-resolved datasets, it streamlines the analytical pipeline into three core functional modules (Fig. 3; see Sections S5 and S6 of the supporting information for details).

|
Figure 3
Control panels of the QXAFS Data Studio software illustrating the automated three-step workflow. (a) Import Data module for binary file reading and automatic sweep splitting based on encoder turning points. (b) Process Data module highlighting cascaded noise reduction and the automated batch energy calibration tool. (c) Post-Process module featuring interactive background normalization, data transformation, and tools for extracting in situ dynamic features. |
(i) Data import and pre-processing. The software rapidly reads binary data files generated by the continuous, high-sampling-rate acquisition of the detectors and Bragg-angle encoder channels. By tracking the encoder signals, it automatically identifies the turning points of the continuous crystal oscillation and separates the decreasing-angle (down) and increasing-angle (up) scans into individual spectra within a single processing run [Fig. 3(a)].
(ii) Data reduction and energy calibration. Addressing the highly oversampled nature of the raw data, this module implements configurable digital filtering—including Butterworth low-pass and Savitzky–Golay filters—to suppress high-frequency noise while preserving the principal spectral features. To convert the measured angular coordinate to photon energy, a fixed energy offset derived from a reference-foil measurement can be applied consistently to all spectra acquired under the corresponding monochromator settings [Fig. 3(b)].
(iii) Post-processing and dynamic analysis. The final module provides a comprehensive toolkit for interactive deglitching, background subtraction, normalization, and standard EXAFS k- and R-space transformations. Specifically designed for time-resolved studies, it features a 3D visualization suite to map the dynamic evolution of the XANES, χ(k), and Fourier-transformed spectra across the entire reaction timeframe. An integrated full-report export function automates the extraction of key spectral parameters (e.g. white-line energy position and intensity), generating exportable reports that directly correlate spectral changes with the in situ reaction progress [Fig. 3(c)].
2.6. Energy calibration
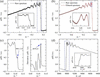
The automated workflow of QXAFS Data Studio is built upon a streamlined data reduction pipeline, illustrated using a representative Cu K-edge spectrum in Fig. 4. The highly oversampled raw data [Fig. 4(a)] are first reduced by binning detector signal intensities that share identical Bragg encoder readouts. This angle-binned signal is subsequently processed through a zero-phase Butterworth low-pass filter with user-adjustable filter order and cutoff parameter to suppress high-frequency noise [Fig. 4(b); see Section S6 of the supporting information for mathematical details]. Following this noise reduction, precise energy calibration is performed.
|
Figure 4
Processing workflow for a single Cu K-edge QXAFS spectrum implemented in QXAFS Data Studio. (a) Raw spectrum extracted from the continuous Bragg encoder trace. (b) Comparison of the raw spectrum (grey) and the filtered spectrum (red) as a function of Bragg angle. The enlarged inset shows that point-to-point high-frequency fluctuations are suppressed while the broader spectral profile remains essentially unchanged. (c) Extraction of energy calibration references for transmission-mode measurements, showing the characteristic peak alignment (left) and the first-derivative maximum alignment (right). (d) The final energy-calibrated XAFS spectrum μ(E). The measurements were performed using a Cu foil with a thickness of 4 µm. |
In transmission mode, energy calibration is conventionally achieved by simultaneously measuring a reference foil placed downstream of the sample. The Bragg encoder value (θ) is converted to photon energy (E) by aligning a characteristic feature of the reference spectrum [e.g. the white-line maximum or the first derivative peak of the absorption edge, Fig. 4(c)] with a tabulated reference value (Eref) using the modified Bragg equation,

where θc represents the angular offset extracted from the reference foil measurement. This procedure directly yields the energy-calibrated EXAFS spectrum [Fig. 4(d)].
In many in situ fluorescence experiments, the severe X-ray attenuation by the reaction cell precludes simultaneous reference measurements. A conventional approach involves measuring a reference foil mounted on the cell window either before or after the experiment (Rüscher et al., 2022; Timoshenko et al., 2022). In the present work, the energy axis was calculated from the Bragg-angle encoder signal and calibrated using a fixed offset determined from a reference-foil measurement acquired under the same monochromator settings. The same offset was subsequently applied to all spectra within the corresponding time series, without spectrum-by-spectrum realignment. This procedure maintains a consistent energy scale while preserving actual sample-induced edge shifts.
3. Performance evaluation and rapid-scan spectral characteristics of the QXAFS platform
This section evaluates the QXAFS platform under practical experimental conditions. It first summarizes the main performance metrics of the system, including the accessible energy range and representative measurements in different detection modes, and then examines scan-direction- and frequency-dependent spectral deviations observed during rapid acquisition.
3.1. Platform performance
3.1.1. Energy range
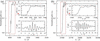
The accessible energy range of the monochromator is determined by the angular limits of the Bragg goniometer and the Si(111) channel-cut crystal optics. The monochromator can oscillate by up to ±2.1° around a selected central Bragg angle, corresponding to a maximum angular scan range of 4.2°. Because the angle-to-energy conversion is nonlinear, the energy window covered in a single oscillation depends on the selected central angle. To benchmark the practical operating energy range, conventional step-scan measurements were performed on standard Ti and Ag reference foils. The resulting high-quality K-edge spectra for both elements (Fig. 5) confirm an effective energy range of 5–26.5 keV for QXAFS measurements at BL11B.
|
Figure 5
Normalized K-edge XAFS spectra of (a) Ti and (b) Ag acquired in conventional step-scan mode. The upper and lower insets in each panel display the zoomed-in XANES region and the k2-weighted EXAFS oscillations, respectively. |
3.1.2. Transmission QXAFS
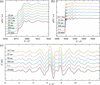
To assess the temporal resolution and spectral quality of the platform, time-resolved Cu K-edge XANES and EXAFS spectra of a standard Cu foil were collected using atmospheric-pressure, nitrogen-filled GICs. Fig. 6(a) presents the XANES spectra acquired at oscillation frequencies ranging from 0.5 to 50 Hz, together with a conventional step-scan spectrum for reference. The characteristic shoulder feature at 8981.3 eV remains discernible even at 50 Hz, corresponding to an acquisition time of 10 ms per spectrum, indicating that the main XANES features remain identifiable during rapid scanning. Furthermore, the EXAFS spectra [Figs. 6(b) and 6(c), and Fig. S10 of the supporting information] retain usable signal quality up to k ≃ 12.5 Å−1 at 30 Hz (16.7 ms per spectrum). This demonstrates the feasibility of tracking in situ oxidation state and local structure evolution on the millisecond timescale. However, the impact of hardware bandwidth on spectral fidelity under such ultrafast, wide-energy-range conditions requires more rigorous quantification, which is systematically addressed in Section 5.
|
Figure 6
Normalized Cu K-edge (a) XANES and (b) full XAFS spectra of a Cu foil acquired with different scan times. (c) Comparison of the corresponding k2-weighted EXAFS oscillations. The scanning parameters for each oscillation frequency (single-scan acquisition time, total angular scan range, and energy scan range) are as follows: 0.5 Hz (1 s, 1.5°, ∼1110 eV); 1 Hz (500 ms, 1.38°, ∼1030 eV); 10 Hz (50 ms, 1.35°, ∼1010 eV); 20 Hz (25 ms, 1.36°, ∼1040 eV); 30 Hz (16.7 ms, 1.18°, ∼840 eV); 40 Hz (12.5 ms, 0.61°, ∼430 eV); 50 Hz (10 ms, 0.33°, ∼230 eV, XANES only). A conventional step-scan XAFS spectrum (10 min) is presented for comparison. All measurements were performed in transmission mode using nitrogen-filled ionization chambers with an amplifier gain of 106 V A−1. |
3.1.3. Fluorescence QXAFS of a dilute ZnO sample
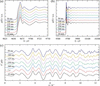
The performance of the fluorescence-mode QXAFS was evaluated by employing an atmospheric-pressure nitrogen-filled GIC and a PIPS detector to monitor the incident I0 and fluorescence intensities If, respectively. We measured a dilute 1 wt% ZnO sample at oscillation frequencies ranging from 1 to 10 Hz, as shown in Fig. 7. Although the signal-to-noise ratio of the EXAFS spectra in both E- and k-space understandably degrades as the oscillation frequency increases, the XANES region retains high spectral quality. This enables the practical tracking of valence changes and white-line shifts on timescales from 50 to 500 ms. For EXAFS, the noise level increases significantly at higher frequencies due to the inherently reduced photon statistics at shorter integration times. Nevertheless, an optimized acquisition time of 500 ms per spectrum (1 Hz oscillation) maintains discernible structural oscillations up to k ≃ 12.5 Å−1, providing signal quality sufficient for fitting structural parameters.
|
Figure 7
Normalized Zn K-edge (a) XANES and (b) full XAFS spectra of 1 wt% ZnO acquired with different scan times. (c) Comparison of the corresponding k2-weighted EXAFS oscillations. A conventional step-scan XAFS spectrum (10 min) is presented for comparison. All measurements were performed in fluorescence mode. |
3.1.4. Measurement of multiple edges
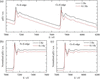
The large total angular scan range of the monochromator (up to 4.2°) provides a wide energy window within a single continuous scan. This makes it feasible to capture multiple closely spaced absorption edges within a single continuous scan, such as the K-edges of neighbouring 3d transition metals or the multiple L-edges of 5d elements. To demonstrate this, we collected the wide-range QXAFS spectra of a molybdate Co0.6Fe0.4MoO4 sample, capturing both the Fe and Co K-edges in a single sweep at oscillation frequencies of 0.1 and 1 Hz. As shown in Fig. 8(a), the raw full-range spectra retain identifiable features across both absorption edges. Furthermore, the normalized absorption spectra for the Fe [Fig. 8(b)] and Co [Fig. 8(c)] K-edges collected at 0.1 Hz show similar edge positions and spectral profiles to those acquired at 1 Hz. Such concurrent multi-element monitoring may be advantageous for investigating complex, dynamically evolving systems such as multimetallic catalysts and battery materials.
|
Figure 8
(a) Wide-range QXAFS spectra of Co0.6Fe0.4MoO4 covering both the Fe and Co K-edges in a single scan. Normalized K-edge XAFS spectra of (b) Fe and (c) Co extracted from the continuous scans. All measurements were performed at monochromator oscillation frequencies of 0.1 and 1 Hz. The spectra are vertically offset for clarity. |
3.2. Scan-direction- and frequency-dependent spectral deviations
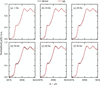
To assess the consistency of rapid-scan measurements, Cu K-edge XANES spectra acquired during the decreasing-angle (down) and increasing-angle (up) branches were compared over the investigated oscillation-frequency range (Fig. 9). The principal absorption edge, shoulder and post-edge features are reproduced in both directions, although small differences remain in the apparent edge position and local spectral shape. These differences vary non-monotonically with oscillation frequency.
|
Figure 9
Comparison of normalized Cu K-edge XANES spectra acquired in the decreasing-angle (down) and increasing-angle (up) directions at oscillation frequencies of (a) 1, (b) 10, (c) 20, (d) 30, (e) 40 and (f) 50 Hz, corresponding to acquisition times of 500, 50, 25, 16.7, 12.5 and 10 ms per spectrum, respectively. Spectra from both directions were processed using the same angular-binning, filtering and fixed energy-calibration procedure. No spectrum-by-spectrum energy realignment was applied. |
Detailed edge-position statistics and encoder-based kinematic analyses are provided in Section S7 of the supporting information. These analyses show that the angular range and local scan rate also vary with operating conditions. The residual differences may therefore reflect the combined effects of the actual monochromator trajectory and the finite response of the measurement chain, rather than a simple frequency-proportional mechanical lag.
4. Application: in situ tracking of electrochemical reconstruction
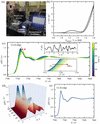
To demonstrate the practical utility of the platform, we performed an in situ QXAFS study on the electrochemical reconstruction of β-CoMoO4, a pre-catalyst for the oxygen evolution reaction (OER) (Zhong et al., 2025). The experimental setup is shown in Fig. 10(a). QXAFS spectra during cyclic voltammetry (CV) in 1 M KOH were recorded using an in-house-developed fluorescence detection system based on the original Lytle detector design (Lytle et al., 1984). The catalyst was deposited on carbon paper as the working electrode, while Hg/HgO and a graphite rod were used as the reference and counter electrodes, respectively. CV scanning between 0.8 and 1.8 V versus the reversible hydrogen electrode (RHE) was recorded at a scan rate of 2.5 mV s−1, and the Co K-edge QXAFS spectra were simultaneously collected with an oscillation frequency of 0.1 Hz (5 s per spectrum). This acquisition condition was chosen to match the comparatively slow catalyst reconstruction observed on the several-hundred-second timescale. At the applied scan rate, the potential changed by only ∼12.5 mV during each 5 s spectrum, which was sufficient for tracking the operando evolution in the present case. Higher-frequency acquisition followed by temporal averaging is also a viable alternative for faster or initially unknown kinetics.
|
Figure 10
In situ QXAFS characterization of β-CoMoO4 under OER conditions. (a) Photograph of the operando electrochemical QXAFS setup at the BL11B beamline. (b) First-cycle CV curve of β-CoMoO4 in 1 M KOH (pH = 13.5) with a potential window of 0.8–1.8 V versus RHE at a scan rate of 2.5 mV s−1. (c) Operando time-resolved Co K-edge QXAFS spectra collected during the CV scanning. The upper and lower insets provide a magnified view of the k2-weighted EXAFS and the absorption-edge (XANES) regions, respectively. (d) 3D surface plot of the Fourier-transformed EXAFS spectra in R-space, illustrating the dynamic evolution of Co coordination structures as a function of the applied potential. (e) Selected XANES spectra extracted every 100 s (5 s per spectrum, 1000 spectra in total) under the pH = 12 condition. The spectra show no systematic edge shift or line-shape change within the observed variation, indicating no significant structural reconstruction within 5000 s. |
The first-cycle CV curve at pH = 13.5 is shown in Fig. 10(b). The time-resolved XANES spectra in Fig. 10(c) reveal a gradual positive shift of the absorption edge and a decrease in the white-line intensity with increasing applied potential, indicating the oxidation of Co ions and reconstruction of the catalyst. More importantly, distinct isosbestic points are observed in the QXAFS spectra, consistent with an interconversion between two dominant spectral species during the reconstruction process. After approximately 490 s, the spectral shape remains unchanged, suggesting that no further detectable spectral evolution occurred under the present measurement conditions. Fourier-transform analysis of the EXAFS spectra in Fig. 10(d) reveals that the Co coordination environment undergoes continuous evolution over the first 490 s, further supporting the rapid reconstruction of the catalyst. The high signal-to-noise ratio of the EXAFS data presented in the inset of Fig. 10(c) demonstrates the suitability of the QXAFS platform for dynamic structural studies.
For comparison, QXAFS experiments conducted at pH = 12 exhibit negligible variations in the XANES spectra over a 5000 s period [Fig. 10(e)]. Compared with pH = 13.5, the milder alkaline condition at pH = 12 showed substantially less spectral evolution within the investigated time window, suggesting that the reconstruction is promoted at higher alkalinity under the present experimental conditions. The spectral consistency also demonstrates long-term stability of the QXAFS platform during in situ measurements.
This in situ demonstration confirms the platform's utility for tracking operando structural evolution during electrocatalysis under realistic experimental conditions. Since the 0.1 Hz acquisition used here represents a relatively conservative operating regime, the following section systematically examines the frequency-dependent noise behaviour and practical performance limits of the QXAFS platform.
5. Physical limits and methodological guidelines for QXAFS
5.1. Methodology of residual-based noise quantification
The spectral quality and performance limits of the QXAFS platform were assessed using the pre-edge residual noise magnitude (σ), defined as the root-mean-square (RMS) magnitude of the residuals within the pre-edge region. This region was selected because its near-zero slope (dμ/dE ≃ 0) reduces sensitivity to small energy-axis variations, while the absence of pronounced absorption features and EXAFS oscillations minimizes contributions from actual spectral structure. To ensure statistical consistency across all analysed oscillation frequencies, the oversampled raw data were rebinned onto a uniform angular grid (e.g. 0.2 arcsec per bin), establishing a consistent coordinate spacing regardless of the scan rate. Only down-scan spectra were included in the analysis. For each valid angular bin, the mean absorption coefficient of all contributing spectra was used as a bin-wise reference, and the residual of each spectrum was calculated relative to this reference. The residual noise magnitude (σ) for a specific spectral region was quantified by the following equation, with the detailed procedure described in Section S8 of the supporting information,

Here, Mvalid is the total number of angular bins satisfying Nj/Ntotal ≥ 70%, Nj is the number of spectra contributing valid data to the jth angular bin, and Ntotal is the total number of consecutive spectra included in the analysis. For a valid bin centred at θj,  denotes the mean absorption coefficient of the Nj contributing spectra, and
 =
 −
 is the residual of the ith spectrum from this local bin-averaged reference.
5.2. Physical origins of noise scaling and instrumental limits
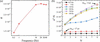
To understand the operational limits of the QXAFS platform, we evaluated the noise scaling behaviour from kinematic and statistical perspectives. As shown in Fig. 11(a), the residual noise σ generally increases from 0.5 to 10 Hz, although the varying slope on the log–log scale indicates non-uniform noise scaling. Above 10 Hz, the departure from statistical scaling becomes more pronounced. This behaviour is consistent with finite-response effects becoming increasingly important relative to shot noise, with the detection chain acting as a low-pass filter at short bin-transit times.
|
Figure 11
Quantitative noise evaluation and statistical independence analysis of the QXAFS platform. (a) Pre-edge residual noise (σ) as a function of oscillation frequency. (b) Scaled variance (σ2N) versus bin-merging factor (N). The upward deviation from independent statistical behaviour at high frequencies (≥10 Hz) quantitatively indicates increasing correlation between neighbouring data points. Annotated points (Δtbin) contrast the near-statistical regime at low frequency (1 Hz) with increased covariance at high frequency (30 Hz), which is mainly associated with the finite temporal response of the detector–amplifier–readout chain: when the effective bin interval becomes too short, signals from adjacent bins partially overlap and lose statistical independence. |
To further examine this interpretation, we evaluated the statistical independence of the data, which is fundamentally governed by the relationship between the dwell time per bin (Δtbin, the physical transit time) and the specific response time of our detection system (10%–90% rise time tr ≃ 20 µs). This temporal dependency is explicitly demonstrated in Fig. 11(b) using the scaled variance (σ2N), where N represents the number of digitized angular increments (0.1 arcsec each) grouped within each bin. In a purely shot-noise-limited system, this value remains constant. At 1 Hz (N = 2), the transit time is Δtbin ≃ 17 µs. Since Δtbin is comparable with the system rise time (1tr), the data retain sufficient statistical independence to form a nearly horizontal plateau. In contrast, at 30 Hz (N = 8), where Δtbin (≃ 4 µs) is significantly shorter than tr, the finite response of the detection chain introduces increasing correlation between adjacent bins. Because the detector–amplifier–readout system cannot fully respond within such a short interval, part of the signal recorded in one bin carries over into the next bin. This temporal overlap breaks the assumption of independent events, causing the sharp upward deviation observed in the scaled variance. Under these conditions, reducing the bin size does not necessarily provide additional independent spectral information. The stark contrast between the threshold condition (∼ 1tr) and the highly coupled state (≪1tr) thus reveals a critical pitfall in data processing: since these highly coupled bins are merely artificially over-segmenting a finite-response-broadened signal, attempting to resolve finer features using a bin size whose transit time (Δtbin) is shorter than the system's response time merely creates a `false resolution'. To accurately reflect the system's true resolving power and to establish a statistically independent baseline, the data binning interval should correspond to a physical transit time of at least 2tr.
5.3. Response-based estimates for data reduction and scan design
Valid QXAFS experimental design requires balancing two fundamental, often conflicting, constraints. To resolve actual spectral features according to the Nyquist theorem, the energy bin size must be sufficiently small (e.g.  ≤ 0.5 eV, approximately one-third of the core-hole lifetime broadening for the Cu K-edge). However, to prevent finite-response-related covariance between adjacent bins, the bin size must physically exceed the energy interval swept by the monochromator during twice the system's rise time (2tr). During a continuous sweep, the maximum instantaneous velocity (vmax) dictates the minimum valid bin size: ΔEmin = vmax2tr. Assuming a nominal sinusoidal scan trajectory, vmax peaks near the centre of the oscillation range, yielding vmax ≃ πfErange. Therefore, to ensure both statistical reliability and spectral fidelity, the experimental parameters must satisfy a dual constraint,

This inequality provides a practical criterion for optimizing scan parameters (f and Erange) according to the specific hardware limits of a given beamline. Taking our detection system (tr ≃ 20 µs) as a benchmark, this constraint establishes the following operational boundaries:
(i) Conventional kinetics (full EXAFS). For reactions permitting slower scans, resolving a 0.5 eV target over a full 1000 eV EXAFS range limits the maximum oscillation frequency of the monochromator to f = 4 Hz (125 ms per spectrum). Operating within this boundary ensures high-fidelity EXAFS spectra with reduced finite-response-induced spectral distortion.
(ii) Ultrafast kinetics (the 30 Hz trade-off). Attempting a full 1000 eV scan at 30 Hz inflates the minimum valid bin size to ∼3.8 eV, fundamentally violating the ≤0.5 eV requirement. To capture ultrafast dynamics at 30 Hz while rigorously maintaining the target energy-binning interval of 0.5 eV, researchers must drastically compress the scanning range. The constraint equation dictates a maximum scan range of Erange ≤ 130 eV, restricting the measurement to the XANES region.
Accordingly, under the present response and sampling conditions, 30 Hz acquisition is better suited to narrow-range XANES than to full-range EXAFS.
5.4. Current limitations and future upgrade pathways
While the platform meets the demands of most in situ experiments, the quantitative evaluation performed in this study highlights clear pathways for further optimization:
(i) Detection system upgrades for dilute systems. For fluorescence-mode QXAFS on dilute samples, the temporal resolution is fundamentally constrained by the statistical flux from the bending magnet and the limited solid-angle coverage of the single PIPS detector. Adopting a multi-element PIPS array would significantly enhance the geometric collection efficiency. Such a configuration optimally balances high photon throughput with the high-frequency dynamic response required by the QXAFS framework, driving simultaneous improvements in both signal-to-noise ratio and effective time resolution.
(ii) Advanced data-driven workflows. Machine-learning denoising and chemometric methods do not remove the fundamental information loss associated with detector-response, bandwidth or sampling limitations. Nevertheless, when sufficient spectral signal is retained, they may still serve as useful complementary tools for QXAFS analysis. Advanced denoising methods (Rüscher et al., 2022; Du et al., 2025) may help reduce predominantly uncorrelated noise, and chemometric approaches such as multivariate curve resolution-alternating least squares (MCR-ALS) (Garetto et al., 2025) may aid the statistical interpretation of evolving or partially overlapping spectral components. In this way, data driven workflows may improve the practical usability of the high-k region of sub-20 ms EXAFS data and support more robust analysis near the instrumental limits identified in this work.
6. Conclusion
A millisecond-to-second QXAFS platform has been successfully established at SSRF BL11B for time-resolved X-ray absorption studies under in situ and operando conditions. By integrating a torque-motor-driven monochromator with synchronized high-speed detection and automated data reduction, the platform enables rapid measurements over 5–26.5 keV, including 10 ms XANES, 16.7 ms full-range EXAFS and 50 ms fluorescence-mode XANES for dilute samples.
A key outcome of this work is the quantitative definition of practically useful scan conditions for the present instrument. The results show that the experimentally meaningful time resolution is governed not only by the nominal scan speed but also by the combined effects of scan range and the finite response of the detection and readout system. For the current BL11B configuration, this leads to recommended monochromator oscillation frequencies of about 4 Hz for full-range EXAFS scans spanning roughly 1000 eV, whereas frequencies around 30 Hz are appropriate when the scan window is reduced to about 130 eV in XANES mode. These recommendations are therefore set by the response performance of the present detection chain and provide practical guidance for experiment design on this platform.
Together with the in situ electrocatalysis demonstration, these results establish BL11B as a user-oriented QXAFS capability and provide a quantitative basis for balancing temporal resolution, spectral coverage and data fidelity in future rapid-scan XAFS experiments.
Supporting information
Sections S1 to S8 inlcuding Tables S1 to S5 and Figures S1 to S14. DOI: https://doi.org/10.1107/S1600577526009781/ret5005sup1.pdf
Acknowledgements
We thank the SSRF beamline operation staff for their continuous technical support, and the SSRF engineering teams for hardware control, data acquisition, mechanical design, alignment, electronics, and safety interlocking during the platform construction and commissioning.
Conflict of interest
The authors declare no competing financial or personal interests that could have influenced the work reported in this paper.
Data availability
The QXAFS Data Studio software developed in this work is currently maintained as an in-house tool specifically optimized for the BL11B beamline at SSRF. The executable software and related documentation are available from the corresponding authors upon reasonable request. The raw experimental data that support the findings of this study are also available from the corresponding authors upon reasonable request.
Funding information
This work was financially supported by the National Natural Science Foundation of China (Grants 12475331 and 12375333).
References
 Amir, M., Deshmukh, R. G., Khalid, H. M., Said, Z., Raza, A., Muyeen, S. M., Nizami, A., Elavarasan, R. M., Saidur, R. & Sopian, K. (2023). J. Energy Storage 72, 108694.
CrossRef
Google Scholar
Bornebusch, H., Clausen, B. S., Steffensen, G., Lützenkirchen-Hecht, D. & Frahm, R. (1999). J. Synchrotron Rad. 6, 209–211.
Web of Science
CrossRef
CAS
IUCr Journals
Google Scholar
Bornmann, B., Kläs, J., Müller, O., Lützenkirchen-Hecht, D. & Frahm, R. (2019). AIP Conf. Proc. 2054, 040008.
Google Scholar
Briois, V., La Fontaine, C., Belin, S., Barthe, L., Moreno, T., Pinty, V., Carcy, A., Girardot, R. & Fonda, E. (2016). J. Phys. Conf. Ser. 712, 012149.
CrossRef
Google Scholar
Chatenet, M., Pollet, B. G., Dekel, D. R., Dionigi, F., Deseure, J., Millet, P., Braatz, R. D., Bazant, M. Z., Eikerling, M., Staffell, I., Balcombe, P., Shao-Horn, Y. & Schäfer, H. (2022). Chem. Soc. Rev. 51, 4583–4762.
CrossRef
CAS
PubMed
Google Scholar
Chen, Y., Gao, Q., Jiang, Z., Li, J. & Zhang, S. (2024). Nucl. Sci. Tech. 35, 92.
CrossRef
Google Scholar
Clark, A. H., Imbao, J., Frahm, R. & Nachtegaal, M. (2020b). J. Synchrotron Rad. 27, 551–557.
CrossRef
IUCr Journals
Google Scholar
Clark, A. H., Steiger, P., Bornmann, B., Hitz, S., Frahm, R., Ferri, D. & Nachtegaal, M. (2020a). J. Synchrotron Rad. 27, 681–688.
CrossRef
CAS
IUCr Journals
Google Scholar
Du, M., Wolfman, M., Sun, C. J., Kelly, S. D. & Cherukara, M. J. (2025). NPJ Comput. Mater. 11, 320.
Google Scholar
Frahm, R. (1988). Nucl. Instrum. Methods Phys. Res. A 270, 578–581.
CrossRef
Google Scholar
Frahm, R. (1989). Rev. Sci. Instrum. 60, 2515–2518.
CrossRef
CAS
Web of Science
Google Scholar
Frahm, R., Griesebock, B., Richwin, M. & Lützenkirchen-Hecht, D. (2004). AIP Conf. Proc. 705, 1411–1414.
CrossRef
Google Scholar
Frahm, R., Richwin, M. & Lützenkirchen-Hecht, D. (2005). Phys. Scr. T115, 974–976.
CrossRef
CAS
Google Scholar
Garetto, B., Cao, N., Finelli, V., Aunan, E., Signorile, M., Olsbye, U., Bordiga, S., Nova, A. & Borfecchia, E. (2025). J. Phys. Chem. C 129, 3570–3582.
CrossRef
CAS
Google Scholar
La Fontaine, C., Belin, S., Barthe, L., Roudenko, O. & Briois, V. (2020). Synchrotron Radiat. News 33(1), 20–25.
CrossRef
Google Scholar
Lu, R. Y., Gao, Q., Gu, S. Q., Yang, Y. Y. & Si, R. (2016). Nucl. Sci. Tech. 27, 82.
CrossRef
Google Scholar
Luo, X. F., Patra, J., Chuang, W. T., Nguyen, T. X., Ting, J. M., Li, J., Pao, C. W. & Chang, J. K. (2022). Adv. Sci. 9, 2201219.
CrossRef
Google Scholar
Lytle, F. W., Greegor, R. B., Sandstrom, D. R., Marques, E. C., Wong, J., Spiro, C. L., Huffman, G. P. & Huggins, F. E. (1984). Nucl. Instrum. Methods Phys. Res. A 226, 542–548.
CrossRef
CAS
Web of Science
Google Scholar
Malta, G., Kondrat, S. A., Freakley, S. J., Davies, C. J., Lu, L., Dawson, S., Thetford, A., Gibson, E. K., Morgan, D. J., Jones, W., Wells, P. P., Johnston, P., Catlow, C. R. A., Kiely, C. J. & Hutchings, G. J. (2017). Science 355, 1399–1403.
CrossRef
CAS
PubMed
Google Scholar
Müller, O., Lützenkirchen-Hecht, D. & Frahm, R. (2015). Rev. Sci. Instrum. 86, 093905.
Web of Science
PubMed
Google Scholar
Müller, O., Nachtegaal, M., Just, J., Lützenkirchen-Hecht, D. & Frahm, R. (2016). J. Synchrotron Rad. 23, 260–266.
Web of Science
CrossRef
IUCr Journals
Google Scholar
Müller, O., Stötzel, J., Lützenkirchen-Hecht, D. & Frahm, R. (2013). J. Phys. Conf. Ser. 425, 092010.
Google Scholar
Nonaka, T., Dohmae, K., Araki, T., Hayashi, Y., Hirose, Y., Uruga, T., Yamazaki, H., Mochizuki, T., Tanida, H. & Goto, S. (2012). Rev. Sci. Instrum. 83, 083112.
Web of Science
CrossRef
PubMed
Google Scholar
Nonaka, T., Dohmae, K., Hayashi, Y., Araki, T., Yamaguchi, S., Nagai, Y., Hirose, Y., Tanaka, T., Kitamura, H., Uruga, T., Yamazaki, H., Yumoto, H., Ohashi, H. & Goto, S. (2016). AIP Conf. Proc. 1741, 030043.
Google Scholar
Olabi, A. G. & Abdelkareem, M. A. (2022). Renewable Sustainable Energy Rev. 158, 112111.
CrossRef
Google Scholar
Pao, C.-W., Chen, J.-L., Lee, J.-F., Tsai, M.-C., Huang, C.-Y., Chiu, C.-C., Chang, C.-Y., Chiang, L.-C. & Huang, Y.-S. (2021). J. Synchrotron Rad. 28, 930–938.
Web of Science
CrossRef
CAS
IUCr Journals
Google Scholar
Richwin, M., Zaeper, R., Lützenkirchen-Hecht, D. & Frahm, R. (2001). J. Synchrotron Rad. 8, 354–356.
Web of Science
CrossRef
CAS
IUCr Journals
Google Scholar
Richwin, M., Zaeper, R., Lützenkirchen-Hecht, D. & Frahm, R. (2002). Rev. Sci. Instrum. 73, 1668–1670.
Web of Science
CrossRef
CAS
Google Scholar
Rüscher, M., Herzog, A., Timoshenko, J., Jeon, H. S., Frandsen, W., Kühl, S. & Roldan Cuenya, B. (2022). Catal. Sci. Technol. 12, 3028–3043.
PubMed
Google Scholar
Shih, A. J., Monteiro, M. C., Dattila, F., Pavesi, D., Philips, M., da Silva, A. H. M., Vos, R. E., Ojha, K., Park, S., van der Heijden, O., Marcandalli, G., Goyal, A., Villalba, M., Chen, X., Gunasooriya, G. T. K. K., McCrum, I., Mom, R., López, N. & Koper, M. T. M. (2022). Nat. Rev. Methods Primers 2, 84.
CrossRef
Google Scholar
Suzuki, M., Kawamura, N., Lytle, F. W. & Ishikawa, T. (2002). J. Synchrotron Rad. 9, 99–102.
Web of Science
CrossRef
CAS
IUCr Journals
Google Scholar
Tai, R. Z. & Zhao, Z. T. (2024). Nucl. Sci. Tech. 35, 137.
Web of Science
CrossRef
Google Scholar
Timoshenko, J., Bergmann, A., Rettenmaier, C., Herzog, A., Arán-Ais, R. M., Jeon, H. S., Haase, F. T., Hejral, U., Grosse, P., Kühl, S., Davis, E. M., Tian, J., Magnussen, O. & Roldan Cuenya, B. (2022). Nat. Catal. 5, 259–267.
Web of Science
CrossRef
CAS
Google Scholar
Vogt, C. & Weckhuysen, B. M. (2022). Nat. Rev. Chem. 6, 89–111.
Web of Science
CrossRef
PubMed
Google Scholar
Wang, G. X., Chen, J. X., Ding, Y. C., Cai, P. W., Yi, L. C., Li, Y., Tu, C. Y., Hou, Y., Wen, Z. H. & Dai, L. (2021). Chem. Soc. Rev. 50, 4993–5061.
CrossRef
CAS
PubMed
Google Scholar
Xie, J. & Lu, Y. C. (2020). Nat. Commun. 11, 2499.
CrossRef
PubMed
Google Scholar
Zhong, X. Y., Hou, C., Chen, Y., Zhang, Z. Y., Li, Y., Gan, T., Liu, K., Gao, Q., Liu, B. L., Huang, Y. Y., Li, J. & Zhang, S. (2025). ACS Catal. 15, 11958–11969.
CrossRef
CAS
Google Scholar
Zhou, Y. N., Yue, J. L., Hu, E., Li, H., Gu, L., Nam, K. W., Bak, S. M., Yu, X., Liu, J., Bai, J., Dooryhee, E., Fu, Z. W. & Yang, X. Q. (2016). Adv. Energy Mater. 6, 1600597.
CrossRef
Google Scholar
This is an open-access article distributed under the terms of the Creative Commons Attribution (CC-BY) Licence, which permits unrestricted use, distribution, and reproduction in any medium, provided the original authors and source are cited.
| JOURNAL OF SYNCHROTRON RADIATION |