

 menu
|
|
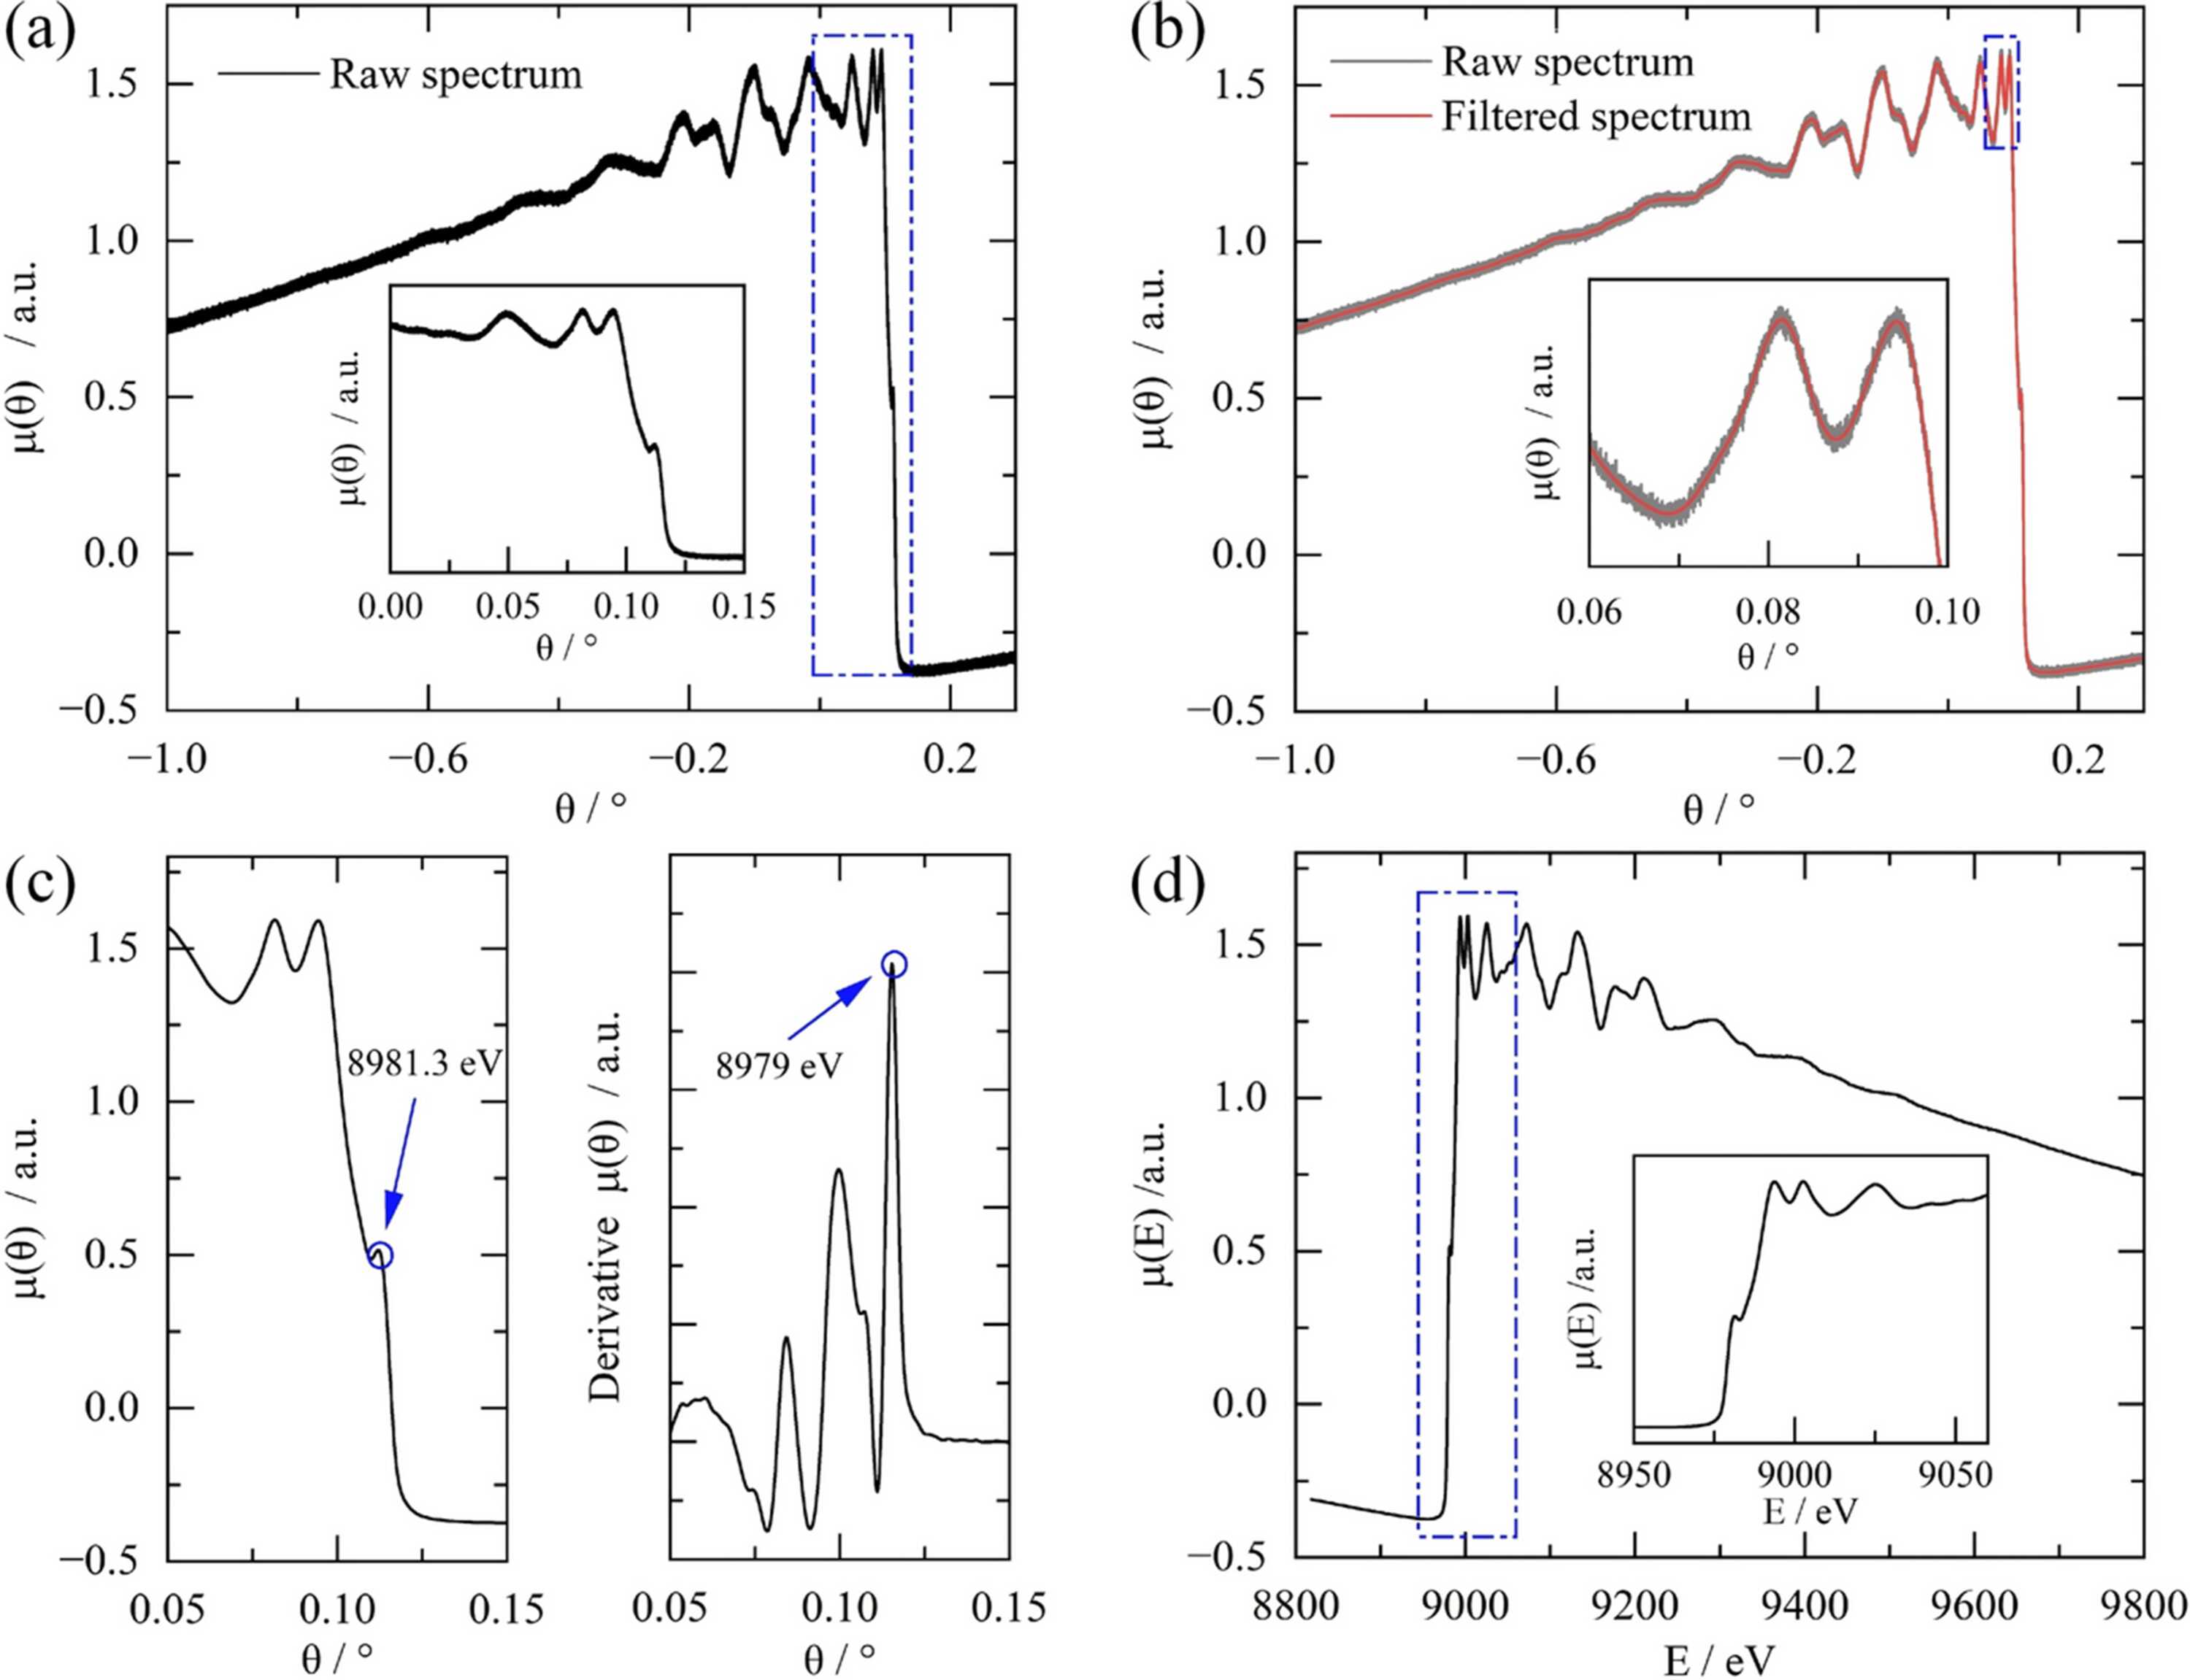
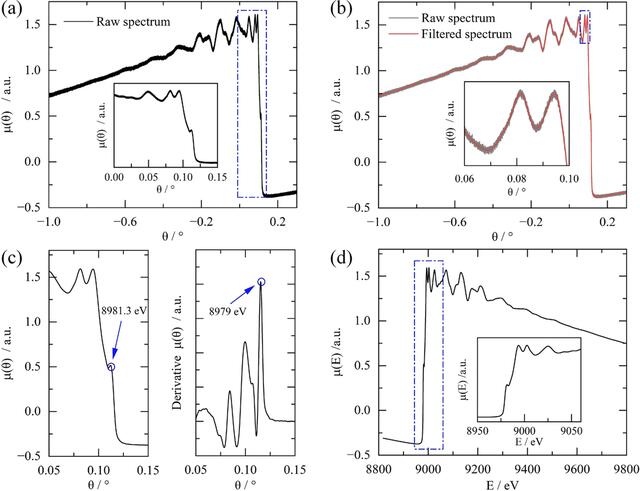
Figure 4
Processing workflow for a single Cu K-edge QXAFS spectrum implemented in QXAFS Data Studio. (a) Raw spectrum extracted from the continuous Bragg encoder trace. (b) Comparison of the raw spectrum (grey) and the filtered spectrum (red) as a function of Bragg angle. The enlarged inset shows that point-to-point high-frequency fluctuations are suppressed while the broader spectral profile remains essentially unchanged. (c) Extraction of energy calibration references for transmission-mode measurements, showing the characteristic peak alignment (left) and the first-derivative maximum alignment (right). (d) The final energy-calibrated XAFS spectrum μ(E). The measurements were performed using a Cu foil with a thickness of 4 µm. |
 | JOURNAL OF SYNCHROTRON RADIATION |
ISSN: 1600-5775
 access