

 menu
|
|
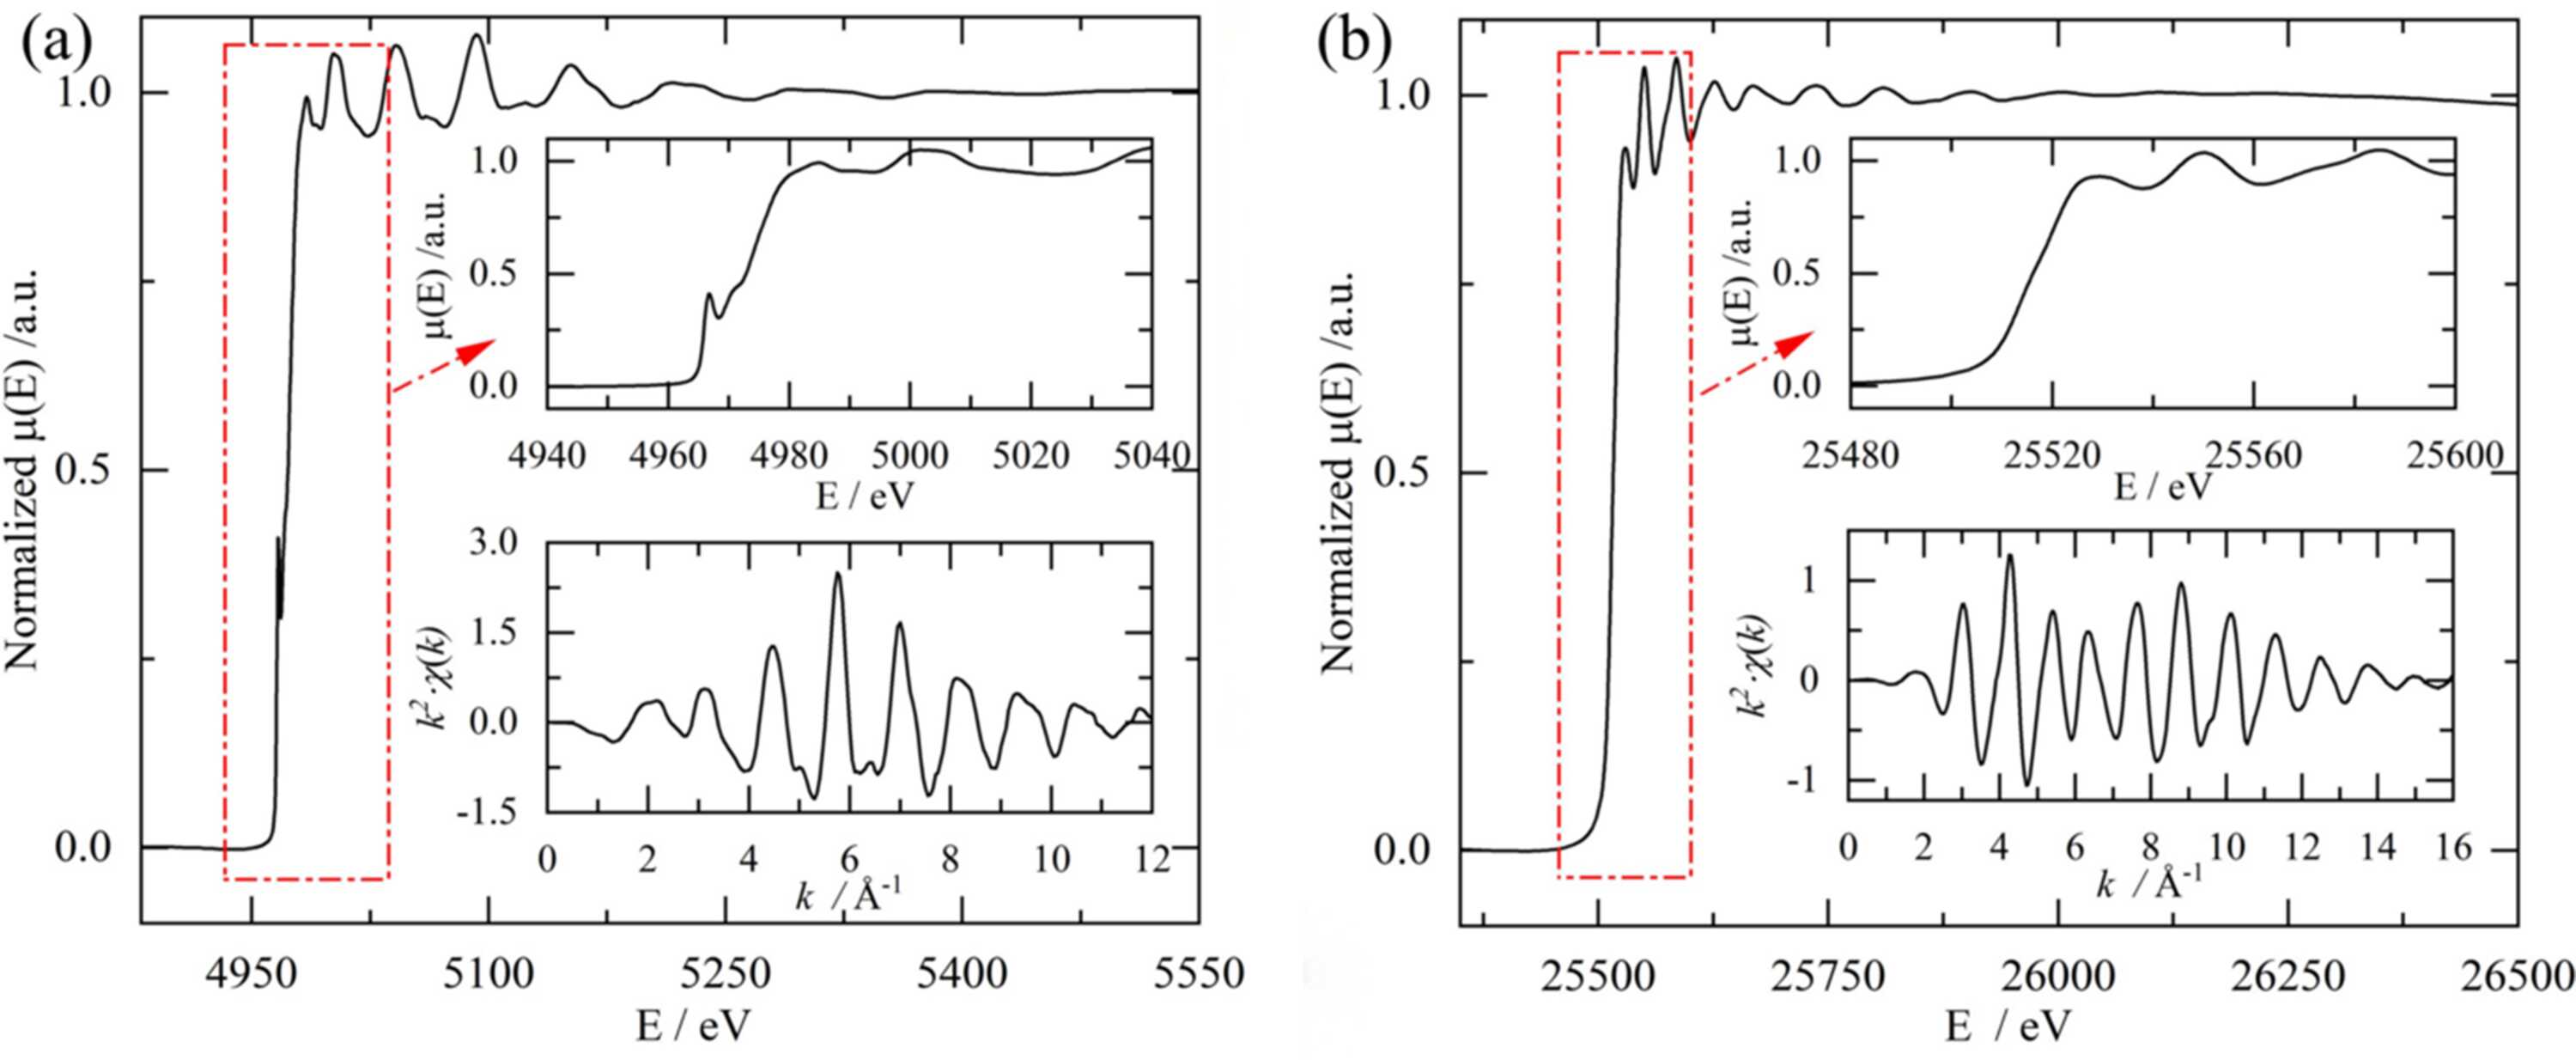
Figure 5
Normalized K-edge XAFS spectra of (a) Ti and (b) Ag acquired in conventional step-scan mode. The upper and lower insets in each panel display the zoomed-in XANES region and the k2-weighted EXAFS oscillations, respectively. |
 | JOURNAL OF SYNCHROTRON RADIATION |
ISSN: 1600-5775
 access